Forecasting the future of Wellington: Telling complex stories of change
Wellington City is changing – fast. In this piece, Penny shares how we forecast population change in rapidly growing areas, to help local councils make informed planning decisions. She also explores how the team at Wellington City have communicated complex stories about forecast population change internally and in consultants with the community.
Wellington’s Long Term Plan (LTP) acknowledges the opportunities and challenges facing the city and the council.
“Our future as a resilient, vibrant and competitive city depends on the decisions we make today. For Wellington to continue to thrive, we need to understand and respond to the challenges we face.”
Planning for growth
Wellington has been experiencing robust growth, and with this growth, the Long Term Plan will outline projects to support continued growth in the city. A bigger population in recent years will test housing, infrastructure and transport systems.
Trying to get to grips with growth rates across a city of more than 200,000 people is a tough task.
This is where the practice of small area forecasting comes into its own because each suburb is unique. Each suburb has a future that will be the outcome of the current population age structure, migration, current housing stock, available land, future development opportunities, the strategy and policy framework and a myriad of other influences.
Wellington City Council has been using forecast.id to pinpoint growth nodes. Being able to forecast where demand for housing, infrastructure and transport will change, and the quantum of change, has been critical to their planning.
Telling a complex story
The planning challenge aside, finding ways to communicate the complex story of growth to Council decision-makers and the community is also difficult. At Wellington City Council, officers report gaining great traction using 3D charts (such as the one below) to depict the variability of growth across the city.
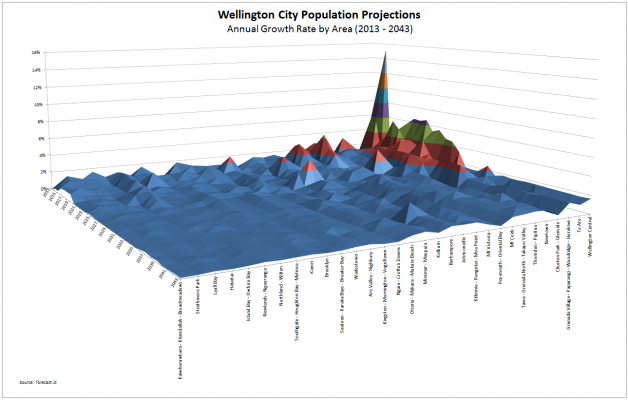
The chart illustrates forecasted growth across 31 suburbs areas over a 30-year window. Forecasts are completed for each year. The towering spikes in the back corner of the chart reveal the very localised nature of growth, with Wellington Central and Te Aro dominating population increases.
The population growth pattern is starkly reflected in the chart. For many neighbourhoods, things will be fairly steady. However, the role of central Wellington is destined to change dramatically as retail and business activity and urban planning carefully accommodates residential growth.
.id is a team of demographers, population forecasters, spatial planners, urban economists, IT and data experts who use a unique combination of online information applications and consulting services to help governments and organisations understand people and places for evidence-based planning.
Penny - Population expert
Based in New Zealand, Penny primarily looks after our Kiwi clients but also lends her expertise to the Australian context. Penny has extensive experience as a Communication Manager in Local Government and has a degree in Business and Communications. She also brings a breadth of generalist management experience in fields as varied as research, civil defence, project and event management, marketing and training. Penny’s knowledge combined with the .id tools help clients work with their communities to empower grass roots decision-making, advocacy and grant applications, and focus on strengthening council-community relationships. Penny has a rural property and enjoys growing and eating food and wine, which she runs, walks, bikes or swims off, when she’s not in the art studio.