BLOG
The top 20 fastest growing suburbs in NSW
The top 20 fastest growing suburbs in NSW
In this blog we delve into .id’s Small Area Forecasts (SAFi), and share the top twenty population growth areas in New South Wales. We also offer some insights into the factors driving growth, and share our thoughts on how businesses and planning authorities can best use the detailed information contained in the SAFi population forecasts.
Note: We have recently updated our population forecasts for NSW. To learn more about the population growth of NSW in the next 2 decades, read: Forecasting the future of NSW: Where will population growth be located?
The top 20 fastest growing suburbs in NSW, 2011-2021
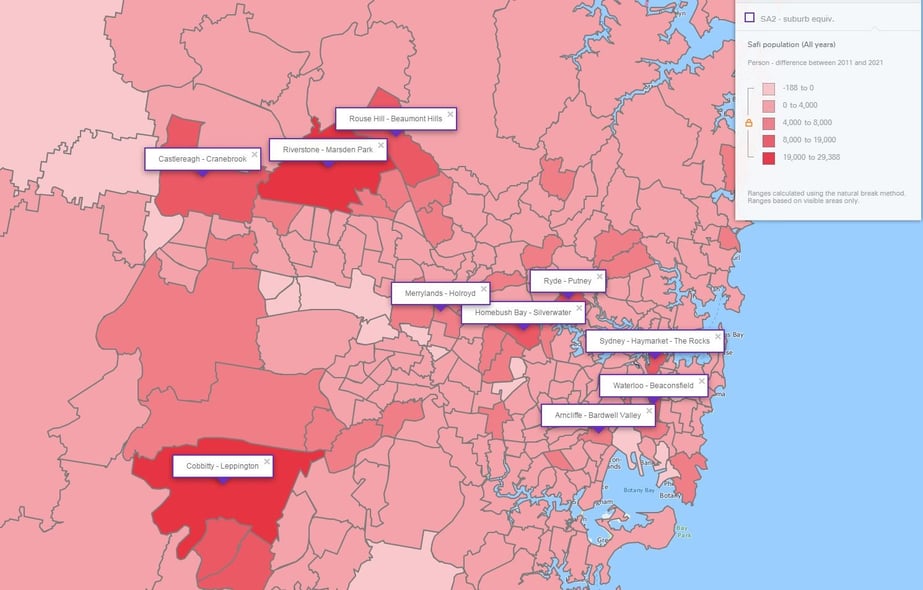
The following table presents the fastest growing areas in NSW, based on SAFi out to 2021. (We are using the term ‘areas’ here as a shorthand to refer to ABS Statistical Areas Level 2 (SA2s) which are a similar size to suburbs).
These areas are ranked by the quantum of population change, but you can see that the areas with the biggest increases in absolute population numbers also tend to have the greatest increases in percentage terms. That is, areas with the largest growth also tend to have the fastest growth rates.
| Rank | Area (SA2) | Net Change 2011-21 | % Change (av. ann.) |
|---|---|---|---|
| 1 | Riverstone – Marsden Park | 29,387 | 12.1% |
| 2 | Cobbitty – Leppington | 27,930 | 18.1% |
| 3 | Waterloo – Beaconsfield | 18,817 | 6.2% |
| 4 | Homebush Bay – Silverwater | 13,575 | 7.3% |
| 5 | Rouse Hill – Beaumont Hills | 11,267 | 4.9% |
| 6 | Castlereagh – Cranebrook | 11,012 | 4.9% |
| 7 | Warnervale – Wadalba | 10,973 | 6.5% |
| 8 | Mount Annan – Currans Hill | 10,571 | 3.6% |
| 9 | Elderslie – Harrington Park | 9,939 | 4.9% |
| 10 | Sydney – Haymarket – The Rocks | 9,436 | 3.2% |
| 11 | Ryde – Putney | 9,399 | 3.0% |
| 12 | Queanbeyan Region | 8,914 | 5.0% |
| 13 | Arncliffe – Bardwell Valley | 7,924 | 4.2% |
| 14 | Prestons – Lurnea | 7,786 | 2.6% |
| 15 | Parramatta – Rosehill | 7,563 | 2.8% |
| 16 | Horsley – Kembla Grange | 7,530 | 7.1% |
| 17 | Kellyville | 7,491 | 2.7% |
| 18 | Hornsby – Waitara | 7,091 | 2.1% |
| 19 | Merrylands – Holroyd | 6,624 | 2.2% |
| 20 | Lethbridge Park – Tregear | 6,378 | 3.2% |
You can see that population growth in NSW is really a two horse race, with Riverstone – Marsden Park SA2 in the Blacktown region just pipping Cobbitty – Leppington in Sydney’s South West. Waterloo – Beaconsfield in Sydney’s inner-city puts in a respectable third place, leaving nothing but daylight back to the rest of the pack.
Source: .id Small Area Forecast information (SAFi) for New South Wales, 2014
Why are these areas forecast to grow so fast?
Not all growth is the same, and at .id, we are always interested in the ‘why’ not just the ‘what’.
In simple terms, demographic changes such as births, deaths and migration determine the size of the population. Housing development influences where that changing population will be accommodated. Therefore it is a key driver of local area population growth.
For the purposes of this analysis we have identified three types of housing development that drive change:
- Greenfield development – where land is repurposed, usually from agricultural uses, and is given over to housing;
- Industrial redevelopment – where areas of a city are converted from other uses to residential, such as an old industrial site, or a golf-course. Also known as brownfield; and
- Urban intensification – where medium and high-density units and apartments start to replace detached housing.
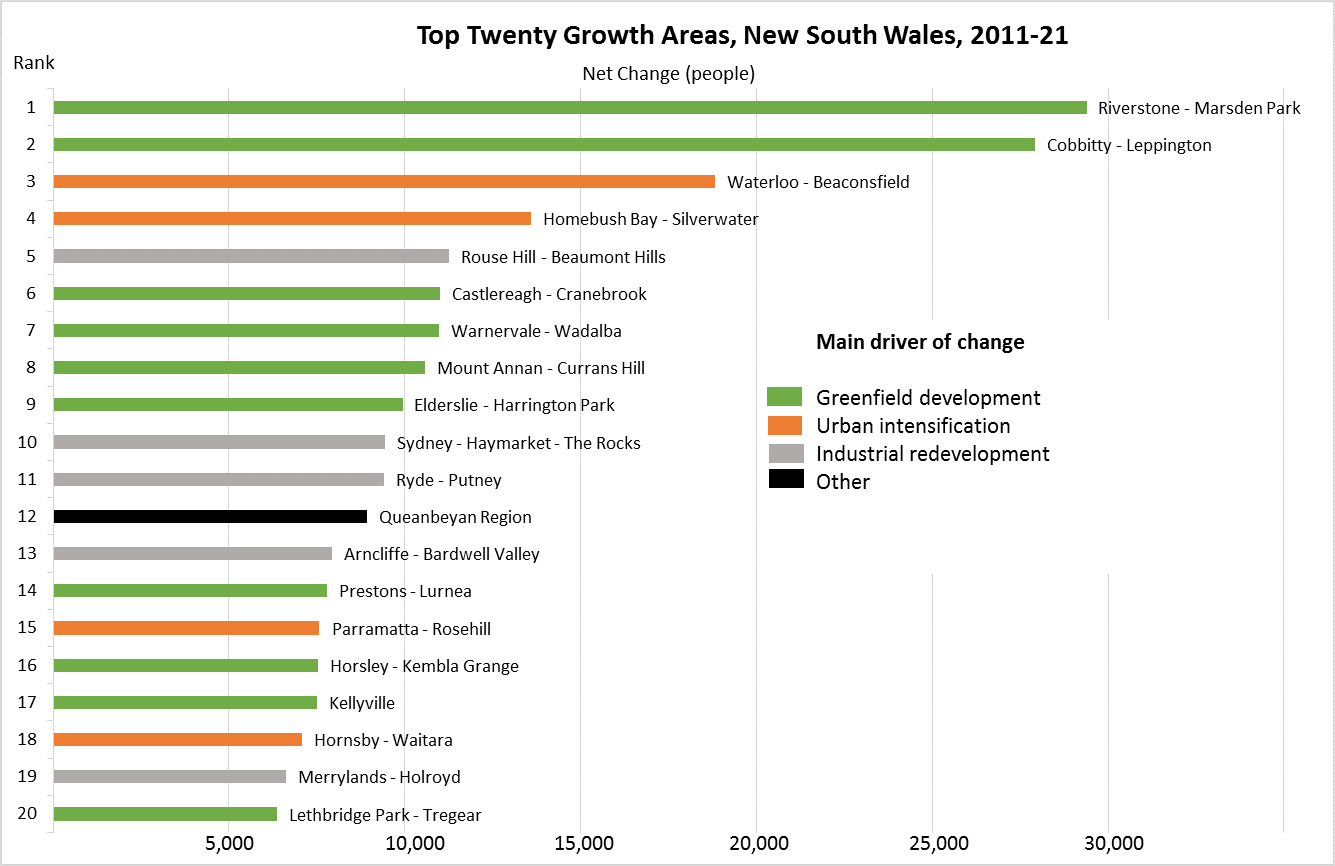
While these categories are not mutually exclusive, and there are often a range of factors at play in any given area, we have highlight what we expect will be the main drivers for each of our top twenty growth areas. This is presented in the following chart, where green bar areas are growing through greenfield development, orange bars represent urban intensification, and grey indicates industrial redevelopment.
Source: .id Small Area Forecast information (SAFi) for New South Wales, 2014
From this, we start to get a sense of the mix of factors driving population growth in NSW in the short term future. For example, the strongest population growth is occurring in areas where large greenfield developments are currently underway in the Riverstone – Marsden Park as well as Cobbity – Leppington which is set to become the major hub of the South West Growth Centre. While Waterloo – Beaconsfield area is classified as an urban intensification area, it also includes greenfield developments at Schofields West and The Ponds.
Urban intensification is an important contributor to increases in dwellings and the associated population growth. Population growth in Waterloo – Beaconsfield is driven by inner-city medium and high-density developments, while growth in Homebush Bay – Silverwater area will come from apartment construction at Sydney Olympic Park.
With a number of high-density developments in train the Sydney – Haymarket – The Rocks area is expected to add almost 10,000 people to its population in the decade to 2021.
Industrial or brownfield redevelopment is another way in which areas can increase the housing stock and attract new residents. There will be strong growth in Rouse Hill – Beaumont Hills in The Hills Shire due to the Box Hill development precinct, as well as the North Kellyville growth centre. The Ryde – Putney area will benefit from the redevelopment of the Royal Rehabilitation Hospital. Arncliffe – Bardwell Valley in the LGA of Rockdale will see a number of high-density residential developments in the Wolli Creek industrial area. And finally, Merrylands – Holroyd area in Parramatta will benefit from the high-density development planned for the Bonds Spinning Mill site.
Not all growth is the same
At .id we specialise in helping business and government prepare for the future. In this sense, it is important to know where growth will occur, not just what growth itself will be.
For example, if you were to purchase a Jim’s Mowing franchise in a fast growing area in inner city Sydney based on the forecast increase in population, you would be severely disappointed. Different development drivers create different opportunities for different businesses.
How Small Area Forecast information (SAFi) helps decision makers
We produce small area population forecasts by bringing together detailed information about housing stock and residential development at the local level, and combining it with our knowledge about how populations are changing.
It is also important to know what the makeup of the population will be. An area might be growing fast, but who is moving there? Is it families? Young or mature families? Empty-nesters? SAFi forecasts include a breakdown of the population by age and sex, with data available on household size and type, to further understand the changing dynamics within communities and help you pinpoint your target market. For example, The Catholic Education Office use them to plan when and where to open schools. The YMCA use test the viability of different health centres, and Japara Healthcare use them to plan their investment in aged care facilities.
If your business could benefit from a nuanced, high-definition understanding of how your market is going to grow, learn more about SAFi here.
Lailani - Population News
Lailani is responsible for content and strategy at .id, ensuring our clients’ needs are central to our enterprise and that we generously share our knowledge with the broadest audience. As a member of our Board, Lailani works with Ivan and Janet to set the strategic direction for the company. Her current focus is our Placemaker consulting business and she has worked with numerous clients across retail, finance, property, local government, education and not-for-profits to put together the best evidence-base for their spatial decision making. With degrees in Business Studies and Economics, she has worked in business development and marketing roles for IBM and SPSS in the UK, as well as a stint as a ranger in Kakadu National Park. Lailani is an Alexander Technique practitioner, surfer and traveller.


