What are the characteristics of seniors living in your community?
If you’re planning for services for the ageing community, it’s critical to understand the specific characteristics of the seniors living in your community. How many are living with their children still at home? Are they downsizing into smaller housing types? What are their education levels and how many are from diverse cultural backgrounds?
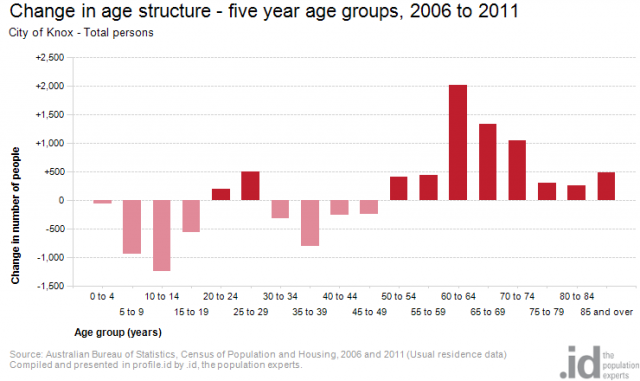
The City of Knox is located in the outer eastern suburbs of Melbourne. It had a large population boom in the 1970s and 1980s, though many areas around the railway lines are substantially older than that. Those who moved in during this boom period are now ageing in place, making Knox one of the most rapidly ageing areas of Melbourne. We will use the City of Knox to illustrate how you can get information about some characteristics of the seniors living in your community.
One of the age groupings on the City of Knox Communities of Interest site is seniors aged 65-79. Traditionally, this is post-retirement age and post family age, but that is changing. We are all being exhorted to work longer, and we know children often don’t leave home until their mid-20s or even later. So how does this affect the ageing population?
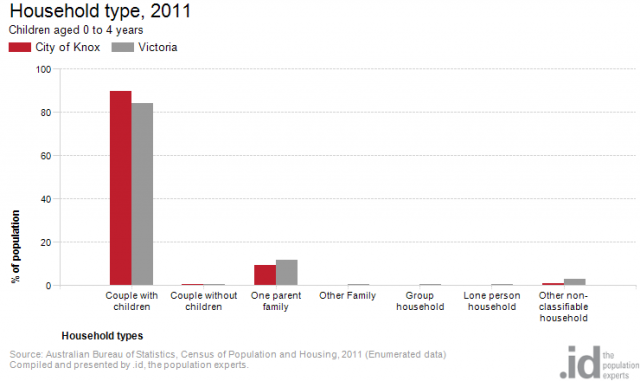
54.4% of these seniors were living in couples without children, but 15.8% still had adult children living at home, and this was an increase of nearly 500 households from 2006. Interestingly, there is a lower rate of lone person households (19.3%) among this group than in Greater Melbourne (21.1%), so more are living with their partners.
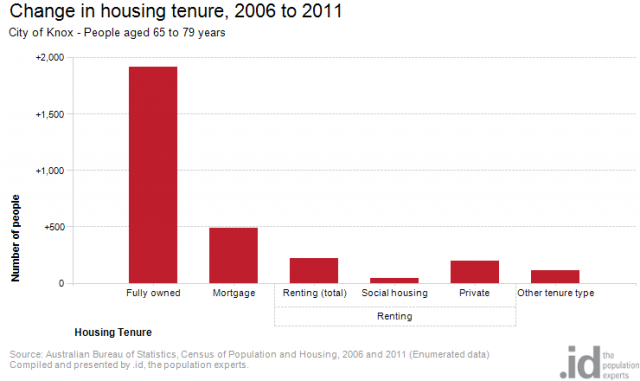
Full home ownership is dominant for this age group, with 72.7% fully owning their homes. This is important for planning aged care, as it indicates the financial means of the older population to buy into care. 12.8% still had a mortgage though, up a little from 2006. The most vulnerable seniors are those in rental accommodation, but this was just 6.6% of the group (Knox overall is not a major rental area but 17% of all dwellings are rented).
The qualifications of seniors in the area reflect the era in which they moved in, and the general qualification levels of the area. Vocational qualifications are popular, with 18.2% of 65-79 year olds having a Certificate level of equivalent, but only 8.3% were university qualified, and more than half had no qualification.
Employment status is a key indicator for those aged 65-79. Anecdotally an increasing number of people are working beyond 65, and current government policy is to encourage this. In the City of Knox, 14.7% of those aged 65-79 were still in the labour force, equating to just over 2,000 employed people in this category. This was a sharp increase from 11.3% in 2006, and the actual number of employed 65-79 year olds rose by 776 people, or 63% – so this is clear evidence that people are working later in life. Around half these workers are part-time, so seniors do reduce their hours even if they don’t fully leave the workforce.
Despite the relatively high rate of employment, seniors are still likely to live in lower income households in Knox, with more than 50% having household incomes between $300 and $999 per week, which includes the age pension range. Increases in incomes relative to the state benchmark show that most of the extra households were in the lower half of state incomes. There was a small increase at the upper end but in percentage terms the upper quartiles declined.

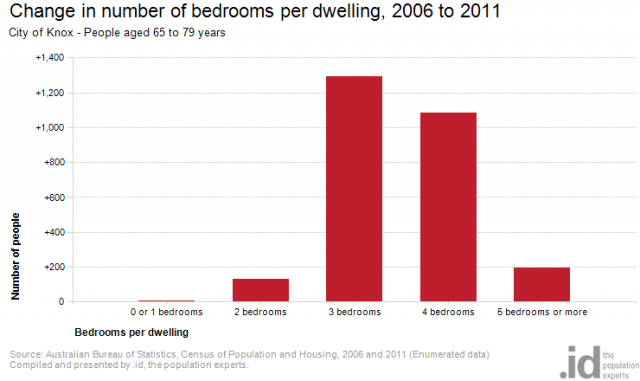
Just over 65% of seniors had an internet connection at home in Knox, compared to 58% metropolitan average, while their dwellings were also larger. Despite most living in couple families without children, over 80% of seniors lived in dwellings with 3 bedrooms or more in 2011, and most of the increase in population were living in 3, 4 and 5 bedroom dwellings. This is a clear indication that, despite the increase in retirement village accommodation in the City, the increase in seniors was mainly due to aging in place in family homes. In Knox, over 86% of seniors were living in separate houses, while the proportion occupying medium density actually declined from 16% to 13% over 5 years. There is no clear indication of substantial downsizing here.
Knox’s seniors are also fairly culturally diverse, with 46.1% born overseas. There is a large population born in the UK (14%), but modest increases among those seniors born in India, Sri Lanka and Malaysia. 21.8% of Knox’s seniors spoke a language other than English at home, though this is a bit lower than the Melbourne average of 31.8%, and declined marginally since 2006.
So, overall, Knox’s 65-79 year olds are a rapidly increasing group, living in family homes, mainly after their children have left home, but an increasing number still with children living at home. They live in large separate houses, with no evidence of downsizing, and are working later in life.
This information is likely to be useful for the many council services assisting the ageing population, and particularly in planning new housing. Forecast.id can also show the likely future change in this population, and in the case of Knox it shows a doubling of this population by 2036, to about 25,000 people, due to purely ageing in place of the current population. In fact there is assumed to be some migration out of Knox among retirees.
Every age group in every place has a slightly different story to tell.
Learn more about analysing communities of interest for your area.
Glenn Capuano - Census Expert
Glenn is our resident Census expert. After ten years working at the ABS, Glenn's deep knowledge of the Census has been a crucial input in the development of our community profiles. These tools help everyday people uncover the rich and important stories about our communities that are often hidden deep in the Census data. Glenn is also our most prolific blogger - if you're reading this, you've just finished reading one of his blogs. Take a quick look at the front page of our blog and you'll no doubt find more of Glenn's latest work. As a client manager, Glenn travels the country giving sought-after briefings to councils and communities (these are also great opportunities for Glenn to tend to his rankings in Geolocation games such as Munzee and Geocaching).


