There’s not a council in New Zealand (or Australia for that matter) not actively encouraging people to make healthy, safe, environmentally sustainable transport choices whether it is through engineering, education or enforcement programmes. In New Zealand the government transport agency, the NZTA is a key partner and funder in these local and national initiatives.
With billions committed to transforming transport what changes are we seeing as a result?
It’s a big subject and there is a lot of regional variation, so for this blog I will focus on national trends using travel to work census results to track shifts in transport mode choice. To find travel to work data for your TA, visit the New Zealand Demographic Indicators site.
Between the 2006 and 2013 census, change in the way people travel to work has been modest and largely a continuation of the 2001 census results. Nonetheless, there are some interesting variations to contemplate.
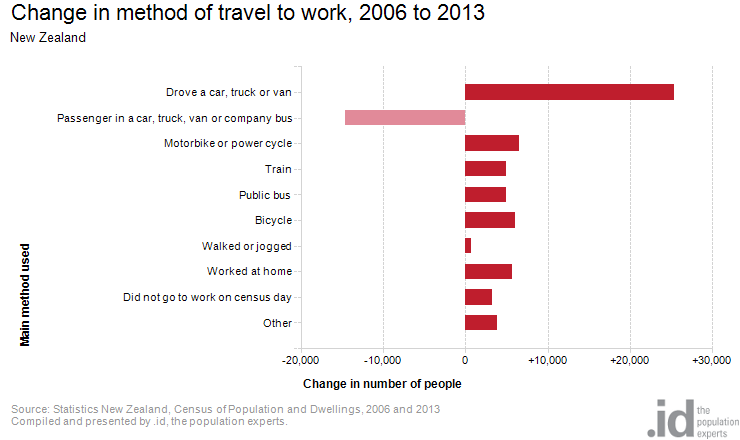
Between 2006 and 2013 the number of employed people in New Zealand increased by 15,231. During the same time the largest changes in the method of travel to work by the resident population in New Zealand (those over 15) were:
- Drove a car, truck or van (+25,449 persons)
- Passenger in a car, truck, van or company bus (-14,637 persons)
- Motorbike or power cycle (+6,516 persons)
- Bicycle (+6,093 persons)
- Train (+4,932)
- Public bus (+4902)
The results are represented graphically in the following chart.

I think that the results are disappointing.
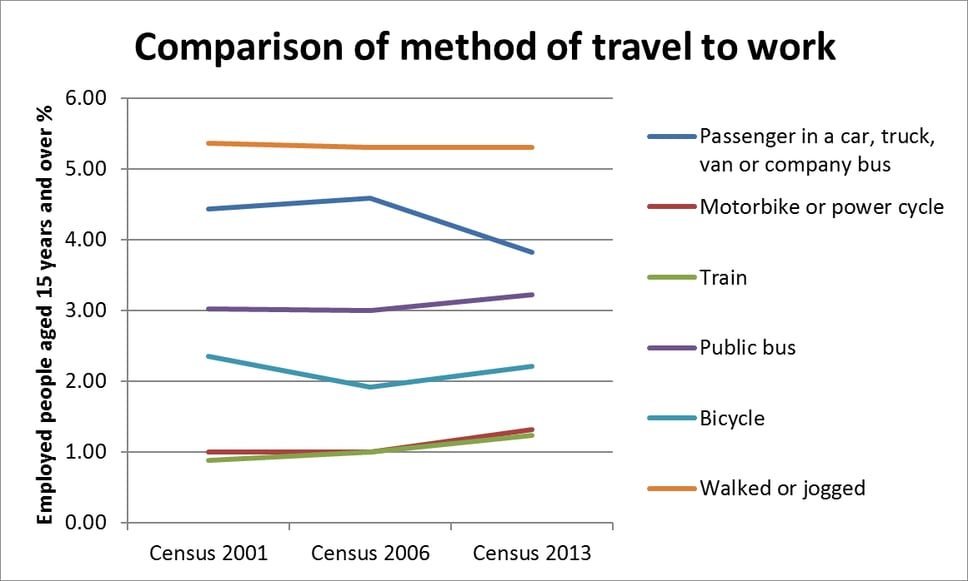
Public transport is key component of local and central governments solution to congestion, transport affordability and network efficiency. Nationally, you can see that patronage of buses and trains for travel to work has been increasing, but the increase has been small. Yet the NZTA, in their National Land Transport Plan, invested nearly $899M between 2009-2012, and nearly a billion dollars ($945M) has been committed to Public Transport planning and infrastructure between 2012 – 2015.
Motorcycle use experienced a small increase, but other alternatives to car travel, namely walking/jogging registered a tiny decline over 12 years and cycling a similar result over the same period.

Overall you could be forgiven for thinking that the recent growth in public transport, motorcycle and biking would translate into decreasing numbers of cars on the road.
Not so.
Car use as a method of travelling to work continues to grow, increasing from 57.7% in 2001, to 58.6% in 2006 and 59.43% in 2013. Unfortunately the option of travel that recorded the largest decrease is passenger travel – not a desired outcome of transport planners.
It appears that the increased emphasis on public transport options may have had a cannibalistic effect on passenger numbers. In a nutshell, public transport has enjoyed modest growth however that outcome does not appear to be as a result of the conversion of drivers, but of passengers.
I guess it’s not quite “back to the drawing board” but the modest results for Public Transport and the concerning fall in passenger numbers coupled with a continuing rise in car travel is worrying. The 2015-2018 NLTP is being drafted at present and it is undoubtedly an important framework for the immediate future of transport in New Zealand, but I can’t help wondering what it will take to change the public mindset on travel apart from perhaps petrol at $3 a litre.
As I said, this blog focuses on national trends and there are big regional variations which you can find by visiting the New Zealand Demographic Indicators site.


