Who will be paying for your latte (or more likely, meals on wheels!) in your twilight years?
While I don’t have a crystal ball to tell you whether your super will be sufficient, understanding dependency ratios can give you an insight into the potential pressures the economy may face…

What is a dependency ratio?
The total dependency ratio tells us the proportion of the population not in the work-force who are ‘dependent’ on those of working-age, it’s a calculation which groups those aged under 15 with those over 65 years as the ‘dependants’ and classifying those aged 15-64 years as the working-age population. It’s a simplistic calculation which is used across the world to understand societies and get a sense of potential pressures the economy may face in supporting an economically dependent population. A youth dependency ratio, or an older dependency ratio, are pretty self-explanatory, they are ratios which compare the proportion of people in those age-groups to those in the working-age population.
One of the obvious limitations of dependency ratios is the assumption that people under 15 years and over 65 years (65+) are outside of the labour force, as well as the assumption that those aged 15-64 are participating in the labour force. We all know that these assumptions are flawed. Dependency ratios are helpful for comparing society over time, as well as to compare counties. Statistics New Zealand included the dependency ratio in suite of population indicators within its sustainable development framework.
How to calculate a dependency ratio
You can calculate the ratio by adding together the percentage of children (aged under 15 years), and the older population (aged 65+), dividing that percentage by the working-age population (aged 15-64 years), multiplying that percentage by 100 so the ratio is expressed as the number of ‘dependents’ per 100 people aged 15-64 years. The higher the dependency ratio, the more people who are not of working age, and fewer who are in the labour force (and paying taxes).

The 2011 Australian Census results tell us that 19.3% of the population is aged under 15, and 14% are over 65. The remaining 66.7% are aged 15-64. The calculation below shows the Australian total dependency ratio in 2011 was 49.9. So, in theory, roughly half of the population is of working-age and supporting the other half of the population, who are either children or retired.

Source: derived from 2011 Census data, Australian Bureau of Statistics.
Australia’s dependency ratio over time
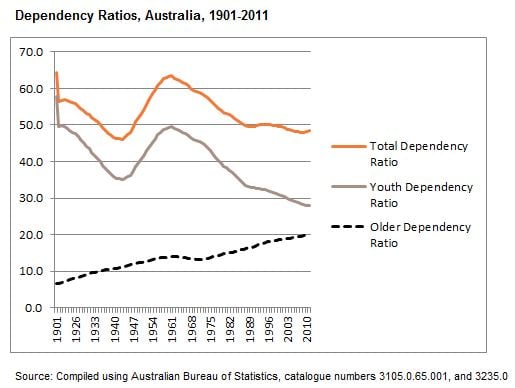
The ABS historical population statistics webpage has a wealth of information, including the population by age from 1901 onwards. These data show Australia’s population in the colonial period was a very youthful one. In 1901 the youth dependency ratio was at its highest with 57.9 children to every 100 people of working-age. There was another peak in the youth dependency ratio around 1960, this is not surprising considering the baby-boom at the time! In 2011 the youth dependency ratio was the lowest ever, with just 28.0 children to every 100 people of working age.

The were fewer people aged 65+ in 1901, the older dependency ratio was at its lowest then, with just 6.6 older people to every 100 people of working age. In 2011 the older dependency ratio reached its highest point to date (20.5).
What about dependency ratios at the local level?
Dependency ratios are usually used at a state, territory or national level, to indicate current and future productivity at a macro level. But what about the local level? It’s easy to calculate a dependency ratio for any area where you have population data by age group, but what does it really tell us? In preparing this blog I came across the Community Resilience in Queensland information portal which includes an older dependency ratio as a measure of population size and structure to inform their understanding of community resilience.
Do you work in local government? Do you refer to dependency ratios in your work? Why not leave a comment below.


