The importance of the "bigger picture" when forecasting
On a recent trip to South Australia with my colleague and frequent blog contributor, Simone, I was fortunate enough to engage in two client meetings. The first was to “kick off” a forecast review for Adelaide City Council, and the second to present draft forecast numbers and assumptions to the District Council of Mount Barker. As we were flying into South Australia (for my first time), I could clearly see the connectivity of places from the coast and Noarlunga (City of Onkaparinga) via the Southern Expressway to Marion and northwards to Greater Adelaide.
What is the relationship between an outlying area of Adelaide and the CBD?
Though the meetings have different purposes, they represent our face to face contact with council staff, and provide us with the opportunity to introduce the forecast.id product, explain our modelling techniques, and also present demographic information which illustrates how their local government area has changed over time (and what we’ve assumed for the future) with regard to population, age/household structure and dwelling supply.
Being able to study two diverse yet nearby councils whose population and migration profiles are directly affected by one another confirmed to me the importance of examining an LGA’s role and function when creating these forecasts, not just as a mutually exclusive entity but also how these areas contribute, connect and interact with their neighbouring local government areas (LGAs) in terms of migration, population change and housing demand/supply.
By assessing these regional interactions and even seeing them from the air as we were coming in to land, we can produce more accurate, robust and realistic population and household forecasts. The drive to Mt Barker from Adelaide via the South Eastern Freeway helped me understand that proximity and strong transport links assist the regional movement of people either on a daily basis (commuters) or as part of longer term migration patterns, such as moving from one LGA to the other for various reasons.
The interaction of the District of Mt Barker and Adelaide City with regard to age specific migration can be seen below.
Who moves to Mt Barker?

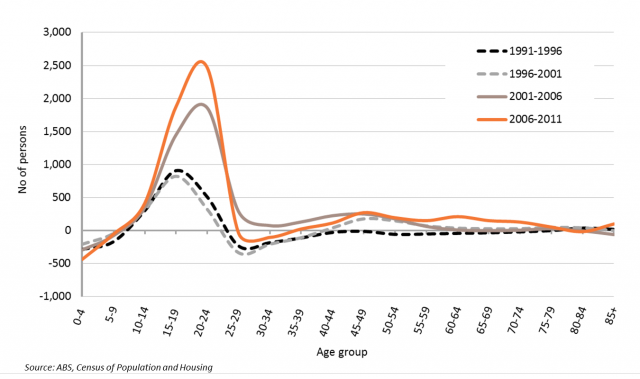
Age specific migration profile, District of Mount Barker
This chart shows net migration by age for Mount Barker. It illustrates a place where young and more recently, established families move to for housing opportunities, a family-friendly, more affordable housing market or as part of retirement/downsizing plans. It also shows net loss of people aged 15-24, the “tertiary education and independent” and “young workforce” service age groups as they leave the District for employment, education opportunities. Our updated population forecasts for Mount Barker will be completed soon as a result of that draft presentation and subsequent feedback from the council where we presented our assumptions which would drive the modelling process.
30-odd kilometres northwest of Mt. Barker, in Adelaide City, we see a different, but related age specific net migration profile.
Who moves to Adelaide City?
Age specific migration profile, Adelaide City
Some other capital city LGAs have similar profiles, for example the City of Perth. Adelaide City attracts some established families and older age groups (a positive net migration profile indicates that more people are coming to an area, rather than leaving it). However, the most obvious influx is of people aged 15-24 from many of the surrounding LGAs similar to and including Mt Barker. This is typical of places like Adelaide City and it is because of the education, employment and other inner city amenities provided that we see the same profile year after year (Census after Census), only magnified by quantity of people. With regard to education, Adelaide offers the University of Adelaide, University of South Australia, and TAFE South Australia to name a few. Adelaide’s employment opportunities for the Public Administration and Safety, Professional/Scientific and Technical Services and Financial/Insurance Services industry sectors are much higher than the rest of South Australia, as can be seen here. Typically, young people will live in the inner city and when they start a family, they’d move to the suburbs where housing is more affordable and better suited to the needs of families. Such patterns are explained well in our suburb life cycle data notes. These would all play a part in attracting the above-mentioned part of the population.
It is because of these relationships that it is important for us to observe, understand and apply regional drivers of change when undertaking local forecasts so we understand how the population moves between different parts of an urban area, the region, state and beyond. Whether it is an inner city LGA with boundaries to adjacent LGAs that aren’t as defined geographically as some rural or remote clients of ours such as the Shire of Roebourne in Western Australia – we need to assess how the local government area we are preparing forecasts for interacts with its neighbours and other regions from near or afar which will alter our client’s future demographic profile.
Access more information about population forecasting here. To view population forecasts of your local government area, visit our online demographic resource centre. Can’t find your council? Email us at info@id.com.au
![]()
Nenad Petrović
Nenad’s background is in geosciences and geographic information systems. At .id, Nenad has experience as both as a demographer and population forecaster. His areas of expertise are place-based analysis, identifying spatial patterns in demographic trends, community profiling, catchment analysis and an understanding of role and function of different communities.