2011 Census – Where are the most multicultural communities?
In an earlier article, I looked at the rise of India, Nepal and Malaysian communities, with falls in older European migration, and spectacular increases in some of the smaller sources of immigrants, like Bhutan and Congo. But how is this increasing diversity distributed across Australia? In areas of high diversity, a large proportion of council services need to be devoted to helping recent migrants settle into Australian society, and areas with large increases may not yet have these services in place.
This article looks at the spatial distribution of multicultural communities – which areas have the highest concentrations of overseas-born and which have had the largest increases between 2006 and 2011. As we saw in the previous article, the proportion of overseas-born population has remained very consistent over time, going right back to the 1800s. The proportion Australia-wide is up a bit, to 24.6% (from 22.2% in 2006), but the more interesting questions are the countries that make up this population (answered in my last post) and where they are located (the subject of this one).
Which states do the overseas-born population live in?
This chart shows the proportion of overseas-born in each state. Western Australia has the highest percentage born overseas, at 30.7%.

The second chart shows Non-English Speaking Background (NESB) population. Since a majority of WA’s migrants are from English speaking countries (particularly the UK and South Africa), it has a much lower NESB proportion, however it’s catching up to NSW and Victoria with a big increase between 2006 and 2011.
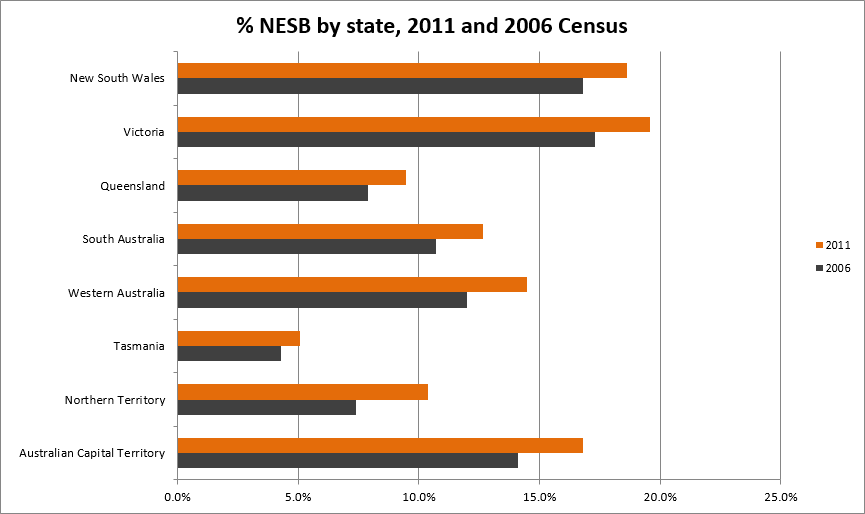
For NESB population, Victoria, at 19.6% now has a higher proportion than NSW (18.6%), though Sydney (26.5%) is still higher than Melbourne (24.3%). Victoria’s state figure is higher as regional Victoria is more diverse than regional NSW (eg. places such as Shepparton and Mildura).
The other thing to take from these charts is that we have got more diverse. There have been big increases, particularly in the NESB chart, in all states between 2001 and 2006. Even Tasmania, which normally gets a very small share of overseas migrants, is showing an increase.
Which are the most diverse Local Government Areas?
This chart shows the Australian LGAs with the highest proportion of population born in Non-English speaking countries in 2011.
This list hasn’t changed much since 2006, though the actual proportion has gone up slightly.
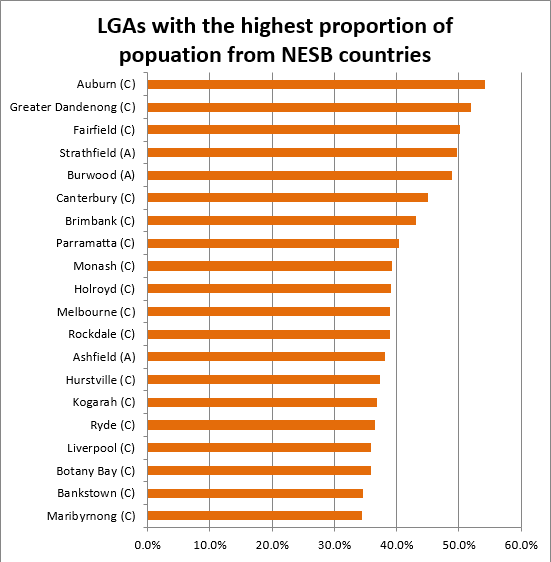
Every one of the top 20 most diverse LGAs is in Sydney (15) or Melbourne (5). Although Perth is catching up in terms of NESB numbers overall, they are more spread out, and the City of Perth, the highest ranked area in WA, comes in at number 21 in the list. Although Victoria has a higher NESB population than NSW, those in NSW are more concentrated, particularly in Western Sydney, so there are more LGAs in the top 20. A select group of 3 LGAs, Auburn and Fairfield in NSW and Greater Dandenong in Vic have more than 50% of their population born in a non-English speaking country.
Within each state and territory, the most diverse LGAs are as follows, with their national ranking and proportion of NESB residents.
New South Wales – Auburn #1 – 54.2%
Victoria – Greater Dandenong #2 – 51.9%
Queensland – Brisbane #81 – 17.6%
South Australia – Adelaide #25 – 32.1%
Western Australia – Perth #11 – 33.8%
Tasmania – Hobart #109 – 12.5%
Northern Territory – Darwin #72 – 19.0%
In states other than Vic and NSW it’s clearly the capital city LGAs which have the most cultural diversity!
What’s happening in the regions?
Regional Australia is generally far less diverse in terms of overseas-born groups than metropolitan Australia, but that is also changing. Many regional areas have experienced increases in migrant groups between 2006 and 2011, due to the large national immigration. In some cases communities have developed in regional cities which are not present in the state capitals (eg. Albanians in Shepparton, Victoria). The highest ranking regional area for NESB population is Coober Pedy, South Australia, which comes in at number 57 in the list, with 21.7% of the population from a NESB. This is followed by Derby-West Kimberley, WA (18.1%). Both are mining areas. Just behind, however is the agricultural area of Griffith, NSW, with 14.3% of the population from a NESB. Griffith has a large Italian community and increasing numbers from places like Afghanistan and India.
So, overall, diversity has increased across the country, particularly in capital cities, and in Western Australia. Sydney, notably Western Sydney remains Australia’s multicultural epicentre though.
And of course we are working hard on getting this data into profile.id. Once this is online, we will be able to explore, for each LGA, individual suburbs and the birthplace, language and ancestry composition of them. All profiles are expected to be online with 2011 data by the end of September 2012.
UPDATE – all community profiles are online and updated with 2011 Census data. You can access them and other demographic information for Australia and New Zealand at our demographic resource centre.

Glenn Capuano - Census Expert
Glenn is our resident Census expert. After ten years working at the ABS, Glenn's deep knowledge of the Census has been a crucial input in the development of our community profiles. These tools help everyday people uncover the rich and important stories about our communities that are often hidden deep in the Census data. Glenn is also our most prolific blogger - if you're reading this, you've just finished reading one of his blogs. Take a quick look at the front page of our blog and you'll no doubt find more of Glenn's latest work. As a client manager, Glenn travels the country giving sought-after briefings to councils and communities (these are also great opportunities for Glenn to tend to his rankings in Geolocation games such as Munzee and Geocaching).