How will the ageing population influence demand for services in NSW?
We hear a lot about the growing cohort of older Australians. However there is much less information on how these citizens will choose to live, and where, as they age. These are vital questions if we are to provide adequate aged care services in the future; the Productivity Commission estimates that by 2050 over 3.5 million Australians will use aged care services each year.
Looking at our largest state, this blog considers: Where will aged care services be most needed across NSW?
Older residents will not be evenly distributed across the state
The Australian Government uses a planning population of people aged 70 + to determine where aged care services will be needed. Using .id’s small area forecast information, we can see where older residents live now and how this will change over the next two decades.
The top 10 regions across New South Wales for residents aged 70+ in 2017 are:
- Sydney – Inner South West (63,485)
- Central Coast (51,535)
- Newcastle and Lake Macquarie (50,325)
- Sydney – North Sydney and Hornsby (47,900)
- Mid North Coast (42, 921)
- Sydney – Parramatta (39,691)
- Illawarra (39,194)
- Richmond – Tweed (38,272)
- Sydney – South West (34,773)
- Hunter Valley exl. Newcastle (32,719)
What is interesting about NSW is that unlike other states (such as Victoria) the largest cohorts of older residents are not simply found in the major city where most people reside overall. Instead the state’s older population can be found in significant numbers along the coast; it already has a highly distributed aged care market.
If we look forward to how the population of NSW will change over the next 20 years, there are a couple of different scenarios across the state.
The power houses
In 2037, the same three regions – Inner South West Sydney, Central Coast and Newcastle – will have the largest number of 70+ residents. These places are already major aged care markets and will on average grow by 67% over the next 20 years.
The up and comers
Other regions will experience significant growth in the number of older residents. This trend is interesting because the areas that will experience the highest growth do not currently top the list for older residents, and are geographically concentrated (see figure 1) – they include the Sydney regions in the South West, Outer South West, Baulkham Hills and Hawkesbury, Outer West and Blue Mountains and Blacktown. These areas will experience over 100% growth in their 70+ population between now and 2037.
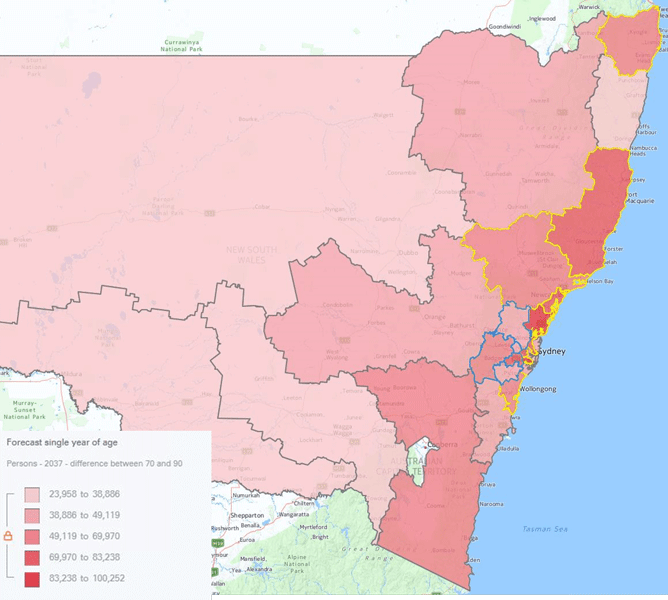
Figure 1 – Population aged 70+ in 2037, with top regions by total number (highlighted in yellow) and highest forecast growth over the next 20 years (highlighted in blue)
The ageing communities
While other regions do not top the charts for the highest number of older residents, many have or will have the highest proportion of older people relative to the rest of the population. For example the Mid North Coast will have 27.8% of its population over 70, compared to the state wide average of 17.3%. This appears to be concentrated in coastal communities, with Southern Highlands, Shoalhaven, Richmond – Tweed, Central Coast and Coffs Harbour – Grafton showing this phenomenon most strongly. These communities face unique challenges as they have a smaller support population (e.g. family members, workforce) to draw on when assisting older people.
The age and rate at which older Australians need assistance is changing
When it comes to providing (as opposed to planning) services, the Government considers a person’s frailty or functional disability, rather than age, to determine if they are eligible for assistance. Given this, to understand the demand for aged care services we need to look at both age and need for assistance.
The ABS conducts a national survey – the Survey of Disability, Ageing and Caring – which provides valuable insight into how older people live. In good news the prevalence of disability among older Australians overall appears to be declining, a reflection of ever improved living standards and medical assistance, decreasing from 52.7% in 2012 to 50.7% in 2015.
However, regardless of whether a person has a disability or not, as we age we are more likely to need assistance in our day to day life. If we use the Central Coast region as a case study, understanding such rates of assistance mean that we can get a more accurate picture of the future demand for aged care services. Figure 2 below compares the forecast population of older residents over the next 20 years, and the rates at which older people need assistance* to scope the likely need for aged care services.
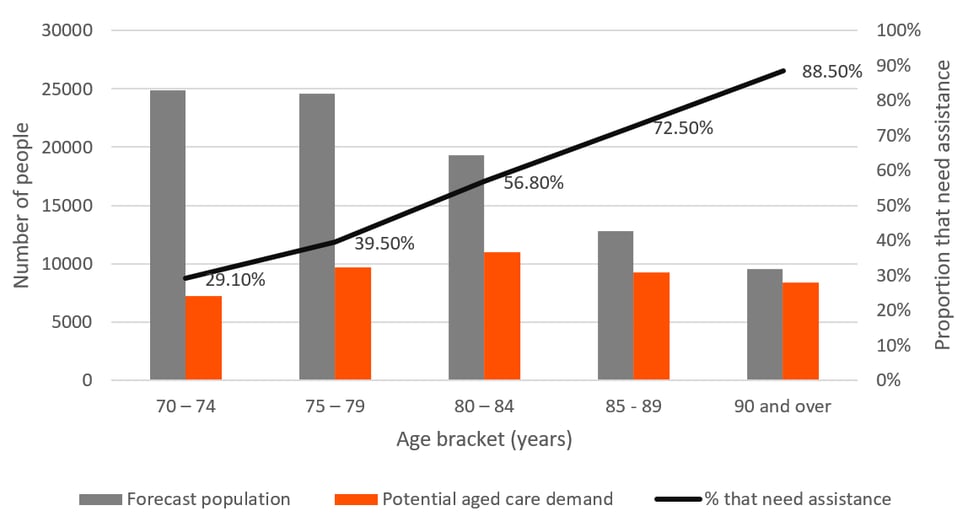
Figure 2: Forecast population aged 70+ in 2037 and proportion of persons needing assistance (source: .id’s SAFi and ABS Disability, Ageing and Carers, Australia: Summary of Findings, 2015)
It highlights some nuances in the demand for aged care services; while there are relatively few 85+ year olds in the general public, and while 70 – 79 year olds are quite independent, both will be almost equally significant consumers in the aged care market.
Service providers will need to refine their networks to match future demand
The Productivity Commission has predicted that of the 3.5 million older Australians that will access aged care services each year by 2050, around 80% of these services will be delivered in the community.
This reflects the current way many older Australians live, with the vast majority living in households (94.8%) as opposed to cared accommodation such as nursing homes (5.2%). The aged care sector is also evolving in response to demand for more flexible and consumer-centered services. Increasingly this means that more Australians are wanting to age within their own homes and have services come to them. Alternatively, if one opts for residential care, a key consideration when choosing a facility is how close or accessible it is to their partners and families.
Given this, it is important to understand where demand for aged care services falls at a local level. To take Newcastle and its surrounds as example, Figure 3 below compares the current supply of aged care services (blue drop pins for residential care and yellow for home-based care) with future demand in the form of the forecast number of residents in 2037 who will be aged 70+.
This spatial analysis quickly shows where there is likely to be supply gaps in the future; by 2037 the largest cohorts of residents will be in the suburbs of Morisset and Cooranbong, however, this area currently has relatively few aged care providers compared to the rest of the region and no home care providers (the increasing preference of consumers).
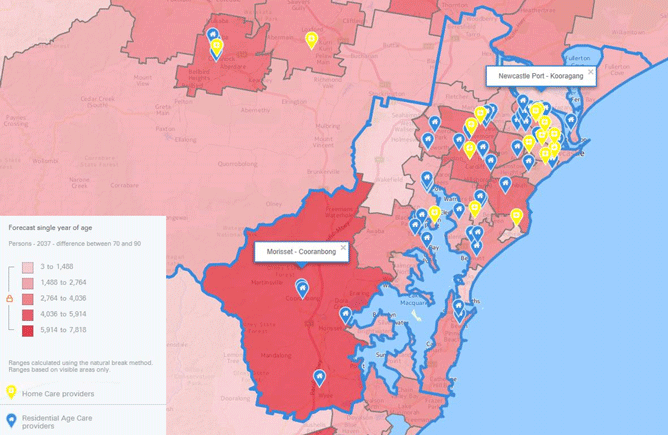
Figure 3: Forecast population aged 70+ in 2037 and current aged care providers (source: .id’s SAFi and the Department of Social Services Aged Care Services List 2013)
The case of Newcastle shows how the aged care market will not only need to keep up with a dramatic growth in demand, but also refine how and where it delivers services to best meet the future needs of older Australians.
*Note: The ABS only calculates rates of needing assistance for persons living in households. However, as it is estimated that 94.8% of older Australians live in households, for the purposes of this analysis, we have applied the ABS’s calculations to the total population.
.id is a team of demographers, population forecasters, spatial planners, urban economists, and data experts who use a unique combination of online tools and consulting to help governments and organisations understand their local areas. Access our free demographic resources here.
Georgie Scanlon
Georgie comes to .id after five years working in strategy and public policy making as a consultant at Nous Group, and for the Queensland state government. She has worked across a range of sectors; past clients include organisations in the energy, primary industries, education, disability, and emergency services sectors. Georgie works with .id’s private, not-for-profit and state government clients to understand, through demographic and spatial evidence, how they can better deliver services to the community. Outside of work Georgie is still surrounded by data – she is currently completing a Masters in Econometrics – and otherwise enjoys cooking, travel and music.