What’s driving the change in Western Australia’s housing?
As Australia’s population grows, the way Australians consume housing is changing. The surge in higher density residential development means that more households than ever are living in smaller homes than the past. In this blog, we take a look at trends in household size, focusing in particular on some interesting changes occurring in Western Australia.
Australia’s average household size
Australia’s average household size has fallen over the past 2-decades. The trend is consistent for Australia’s larger states, although there has been a subtle upswing in recent times. The decline in average household size reflects both decreases in family size (people are having fewer children) and increases in lone person households (especially in older age groups), as well as changes to the types of dwellings that householders are choosing.
Average household size, selected states and Australia, 1991-2011
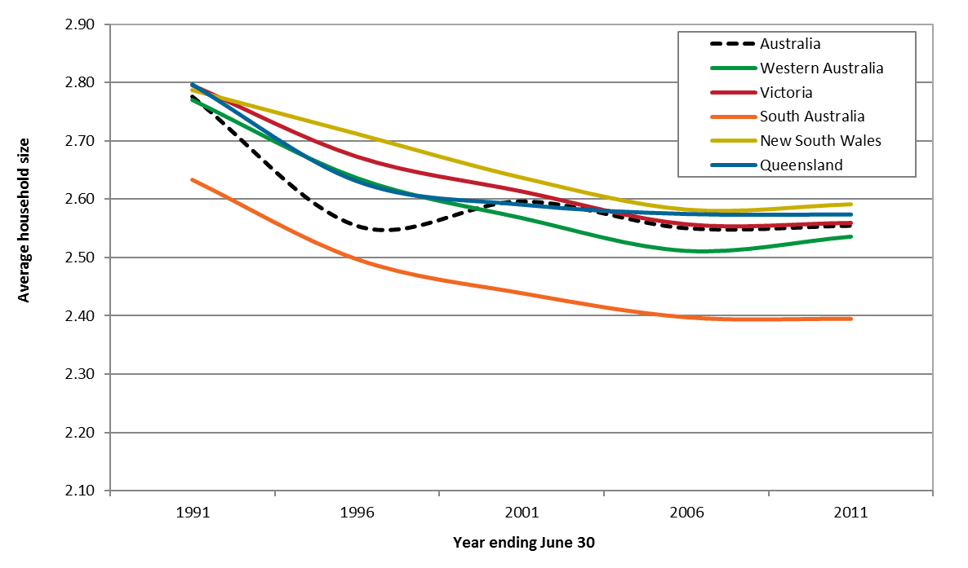
Source: ABS, Census data.
Household size in Western Australia
When you drill down into the state household data in Western Australia, trends start to vary. Households in Perth have long been smaller than those in regional WA. But this has recently turned around, with average household size in regional WA now smaller than that of Perth.
Average household size, Western Australia and major regions, 1981-2011
Source: ABS, Census data, 1981-2011, Australian Demographic Statistics (Cat. 3101.0), 2012
Until 20 years ago the conventional wisdom held that average household size tended to fall over time however, there has been a turn-around in recent times. This reflects the high level of population growth concentrated in metropolitan Perth and illuminates the dwelling supply and demand equation.
Housing WA’s growing population
In the last decade, over half a million people have been added to WA’s population, boosting the state’s total population to over 2.6 million.
The chart below shows the correlation between population growth and building approvals since 1991. Through the 1990s and early 2000s, the relationship between population growth and the number of building approvals each year was fairly close, until the recent boom in population. As population growth surged in WA during the mining resources boom, housing supply remained fairly constant, highlighting a large disparity between supply and demand. This shows the pent-up demand in for residential dwellings in WA, and especially in Perth. By 2014, with population growth declining, the balance between population and housing was largely restored.
An interesting social response to housing under-supply we have been researching is the increase in ‘multi-family households’ (where more than one family share a dwelling) which in effect increases the average household size. This is an interesting topic we can explore in a future blog.
Population growth and building approvals, Western Australia, 1991-2017*
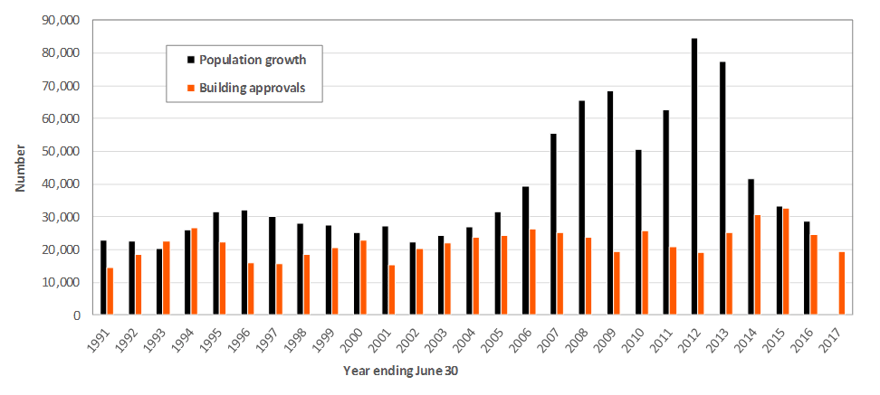
* 2017 based on 6 months of data
Source: ABS, Australian Historical Population Statistics, 2014, ABS Building Approvals, 2017
What’s impacting household size in WA?
There have been big increases in the number of people living in non-private dwellings (NPDs) in WA, as illustrated below. When a household member moves from being the usual resident of a private dwelling (eg. the family home) and becomes the usual resident in a non-private dwelling such as onsite accommodation at a mining camp, the size of an average household can be impacted. The chart below shows the substantial increase in the number of people living in non-private dwellings, particularly in regional WA between 2006 and 2011.
Usual residence in a non-private dwelling, Western Australia
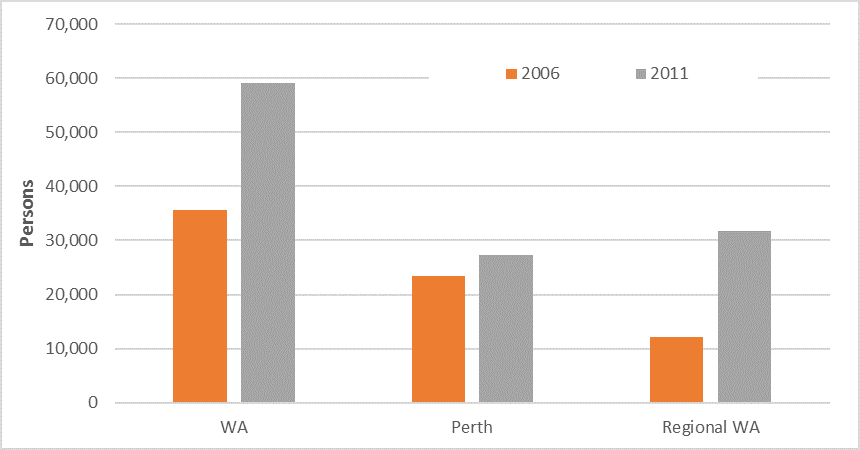
Source: ABS Census data 2006, 2011.
The number of NPD residents in metropolitan Perth increased around 15% between the 2006 and 2011 Censuses, growing from 23,300 to 27,300. There was a 60% increase in regional WA, increasing from 12,200 in 2006 to 31,800 in 2011. In the Pilbara-Kimberley region, the number of people living in non-private dwellings (predominately mining camps) has increased 5-fold (see table below). This reflects the huge increases in mining activity in that period. We are eagerly anticipating the publication of the results of the 2016 Census, particularly considering the downturn in the mining sector since the last Census.
How a person responds to the usual address question in the Census can vary from person to person, especially in unconventional living arrangements such as that provided by employers in remote areas. The fly in/fly out (aka FIFOs) phenomenon is explored in this blog.
Residential non-private dwellings include aged care facilities as well as defence force facilities, hospitals, prisons, staff quarters and boarding houses. As a rule, an increase in people aged 18 to 24 living in non-private dwellings indicates a growth in student accommodation, defence force facilities or prisons. Similarly, an increase in people aged over 75 living in non-private dwellings indicates growth in aged care facilities.
Growth in non-private dwelling as place of usual residence, Western Australia, 2006-2016
Source: .id, SAFi, 2017: unpublished data
Read more about WA’s population change in our eBook, Western Australia: Is it all doom and gloom after the boom?
.id is a team of demographers, population forecasters, spatial planners, urban economists, IT and data experts who use a unique combination of information, applications and consulting to help governments and organisations understand people and places for evidence-based planning. Access our free demographic resources here.
Esther - Team Forecast
Esther joined .id after working in the demography teams at both Statistics New Zealand and the Australian Bureau of Statistics producing national and regional statistics. Esther produces the top-down model for .id’s SAFi (Small Area Forecast information). This involves synthesising overseas, interstate and regional migration patterns to quantify regional change. Esther loves the way statistics assist in understanding our communities and can dispell urban myths or stereotypes.