What’s driving change in your economy’s competitive industries?
We are often asked by local governments and regional bodies how to understand the competitive and non-competitive industries of a region. In addition to using Location Quotients (read our previous blog on using LQs) to understand the dominance of different industries, shift-share analysis can provide a more detailed understanding of what’s driving competitive changes of industries in a region.
To make this analysis easier for economic development practitioners, a shift-share analysis tool is now included within economy.id.
Related insights:
- Upcoming data updates on economy.id – jump to the release schedule
- Register your interest in engaging our economic experts to undertake an economic health check for your region
Using shift-share analysis
While Location Quotients help identify the industries increasing or declining in importance over time, it cannot identify whether this is due to local factors or macro trends. This is where shift share analysis comes in. Shift-share analysis is a technique used to break the growth or decline in an industry into three components to help understand what is driving the change.
The three change components of shift-share analysis are commonly known as:
- Macro (national/state) growth effect – the amount of growth or decline in an industry that could be attributed to the overall growth of a larger area that encompasses the region’s economy, usually state or national.
- Industry mix effect – the amount of growth or decline in an industry that could be attributed to the performance of the specific industry at the national/state level.
- Regional competitive effect – the amount of growth or decline in a specific industry that could be attributed to a local competitive advantage or disadvantage. This is generally the most interesting component as it clearly quantifies the level of advantage or disadvantage an industry has in the local area.
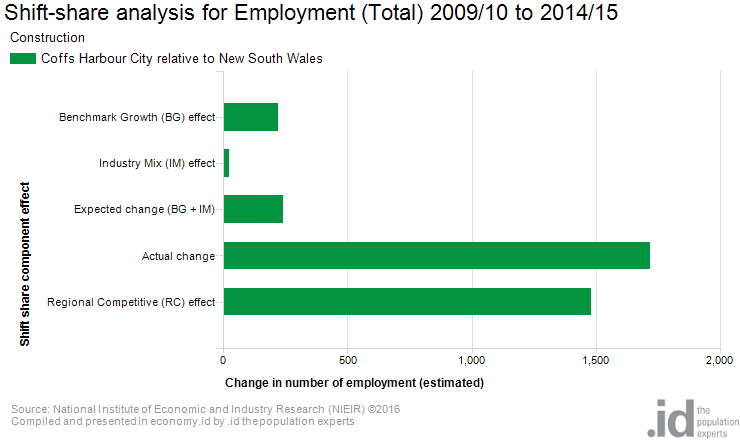
To understand what the different components mean we can look at the shift share analysis of the Coffs Harbour economy between 2009/10 and 2014/15. If we consider employment in Construction, we would have expected employment to have increased by 240 jobs. This is a combination of +219 jobs because NSW’s economy grew overall during this period, and +21 jobs because Construction was growing faster than the state average growth rate. However, Construction employment in Coffs Harbour actually increased by 1,721 jobs. Therefore, we assume that some regional factors led to the sector growing much greater than expected during the period, by approximately 1,482 jobs (1,721 – 240).
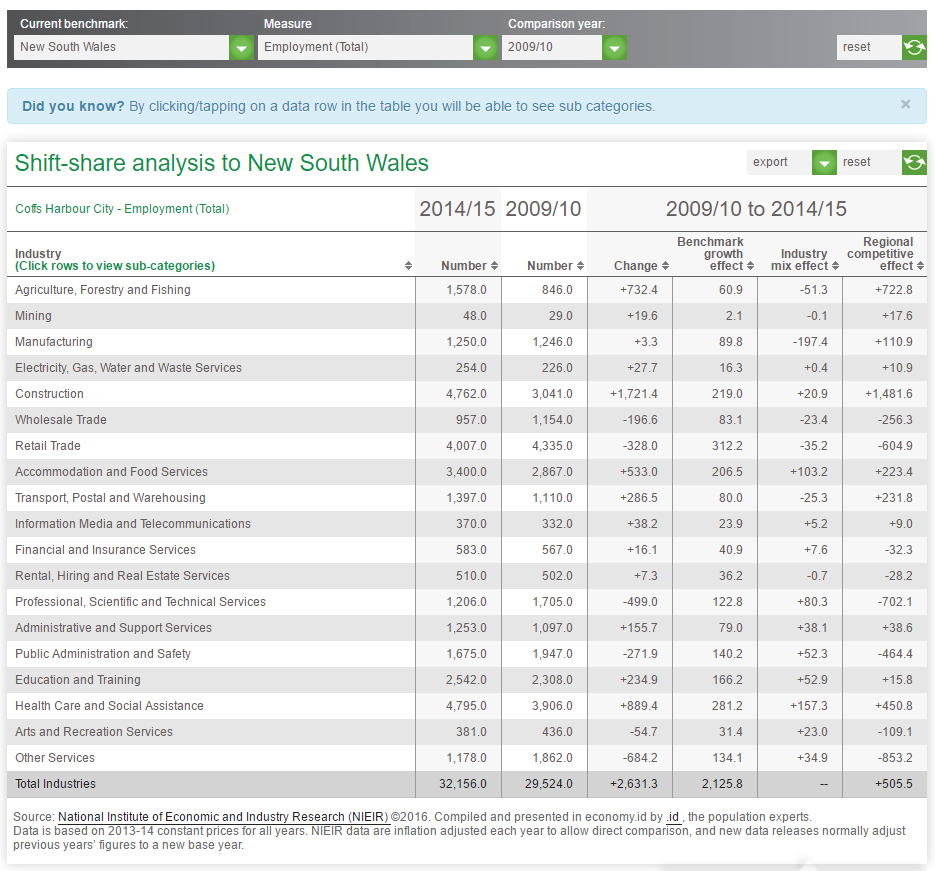
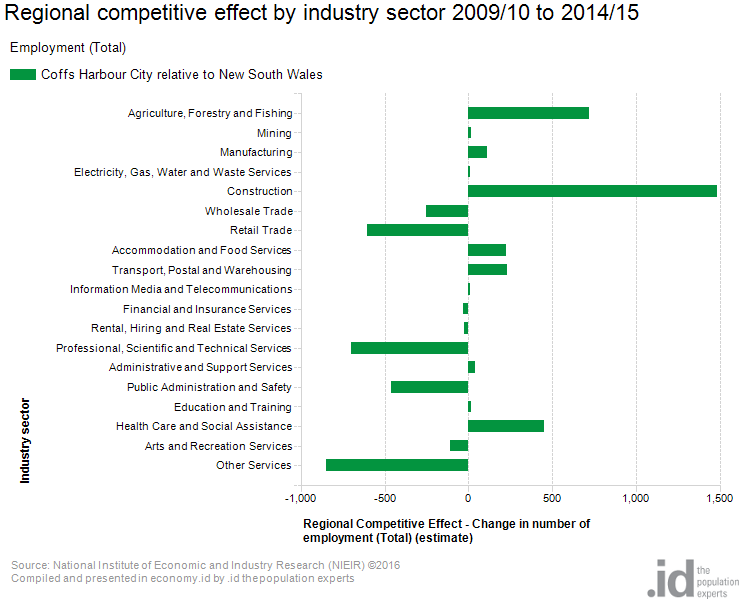
Looking purely at the regional competitive effect, we can see that growth in construction and agriculture, forestry and fishing were well above trend. Increases in healthcare, hospitality, manufacturing and logistics based employment were also greater than what would’ve been expected given macro trends. In contrast, professional services, other services and retail experienced job losses in this period which went against state trends. Some sectors, like Rental, Hiring and Real Estate Services, experienced employment increases but growth was lower than that experienced at a state level (therefore resulting in a negative regional competitive effect).
Digging deeper – local knowledge
There is no substitute for local area knowledge. Location quotient and shift-share analysis can highlight areas of competitive advantage/disadvantage or industries with above trend growth/decline but it takes extra research, or on the ground experience, to interpret the results. For example, people living in Coffs Harbour would know that the Pacific Highway upgrades have driven a large boost in construction employment during this period. However, the analysis can sometimes spring surprises or even just illustrate just how weak or strong certain sectors are compared to benchmark regions. It can also reveal whether some sectors are in danger of losing their competitive position.
Check out the shift-share analysis tool under the Economic tools menu in economy.id.
.id is a team of demographers, urban economists, spatial planners and data experts who use a unique combination of online tools and consulting to help governments and organisations understand their local economies. Access our free economic resources to help profile your local economy.
Keenan - Economic Development Specialist
Keenan is an economic development specialist who has worked extensively analysing and developing economic programs, strategies and policies to help local communities. Keenan works with our local government clients to help them explore and understand how their regions are changing over time to help them make better decisions and create evidence-based strategies related to local economic development.