Biggest, fastest, slowest – latest population growth and change in Australia
Each year the ABS releases population data for LGAs and other small area geographies in Australia, and the latest publication was recently released. As always there’s some very interesting data in this release, and the .id team (mainly Glenn and Simone) will be preparing a number of blogs using this data over the coming weeks.
Australia’s cities
In 2014-15, Australia’s population grew by 1.4%, or 317,100 persons to reach 23.8 million. Greater Sydney remains our biggest city, with a population of 4.92 million, followed by Greater Melbourne (4.53 million) and Greater Brisbane (2.31 million). Greater Melbourne recorded the greatest volume of growth – 91,600 persons, and this was also the highest growth rate at 2.1%. Greater Sydney continues its recent growth spurt, adding 83,300 persons (1.7% growth rate) and if it maintains this trend will hit 5 million sometime in the next year. Population growth in Greater Sydney and Greater Melbourne continues to far outstrip that of other capital cities and its notable that Greater Brisbane added more persons to the population in 2014-15 than Greater Perth (35,200 and 31,100 persons respectively). The slowdown in Perth’s growth is no surprise given recent macro level demographic trends in Australia and this is now being reflected in data for smaller geographic areas such as LGAs. The volume of growth in Greater Perth is half of what it was just two years ago.
If you are interested in the population trends of Australia’s cities, you may also be interested in om of our articles in this blog series:
Will Melbourne’s population overtake Sydney?
The changing fortunes of population growth – Sydney and Perth
Latest figures show population further concentrated in Australia’s capital cities
Where are the fastest growing areas?
The ABS does a great job at providing analysis of this data for SA2s on its website, but this analysis will focus on LGAs. Most of the fastest growing LGAs were located in Australia’s capital cities, typically on the urban fringe – but of course there are notable exceptions. The table below shows the fastest growing LGAs (top 20) as measured by the growth rate in Australia during 2014-15.
| Rank (a) | LGA Name | State | Population – 2015 | Growth rate 2014-15 (%) |
| 1. | Camden | NSW | 72,256 | 7.6 |
| 2. | Serpentine – Jarrahdale | WA | 24,108 | 7.2 |
| 3. | Melbourne | VIC | 128,980 | 5.6 |
| 4. | Wyndham | VIC | 209,847 | 5.1 |
| 5. | Litchfield | NT | 23,614 | 5.1 |
| 6. | Whittlesea | VIC | 195,397 | 4.6 |
| 7. | Cardinia | VIC | 90,884 | 4.4 |
| 8. | Armadale | WA | 80,287 | 4.4 |
| 9. | Botany Bay | NSW | 46,587 | 4.2 |
| 10. | Melton | VIC | 132,752 | 4.0 |
| 11. | Kwinana | WA | 37,149 | 3.9 |
| 12. | Walkerville | SA | 7,673 | 3.7 |
| 13. | Sydney | NSW | 205,339 | 3.6 |
| 14. | Lane Cove | NSW | 35,959 | 3.4 |
| 15. | Casey | VIC | 292,211 | 3.2 |
| 16. | Yarra | VIC | 89,151 | 3.2 |
| 17. | Auburn | NSW | 88,059 | 3.1 |
| 18. | Murray | WA | 17,262 | 3.1 |
| 19. | Rockingham | WA | 128,962 | 3.1 |
| 20. | Swan | WA | 133,303 | 3.1 |
(a) Table refers to LGAs with populations of 5,000 or more persons.
Source: ABS, Regional Population Growth (ABS Cat. no. 3218.0)
Australia’s fastest growing LGA in 2014-15 was Camden Council, located in Sydney’s outer south west. In recent years, the rate of growth has accelerated and has generally been above 3.0% since 2007. Camden’s growth rate of 7.6% represented an increase of 5,100 persons in 2014-15. Most of this growth is occurring in new greenfield estates in suburbs such as Oran Park and Gregory Hills. Furthermore, there is considerable scope for growth well into the future across the northern part of the LGA in the coming decades.
Other fast growing LGAs in Sydney were located in established areas, reflecting the well established trend of apartment building. Botany Bay’s recent growth spurt in the Mascot Station Precinct was reflected in its strong growth rate of 4.4%. In contrast, aside from Melbourne City, which grew by 5.6%, all of the other fast growing LGAs in Melbourne were located on the urban fringe. Again, this continues well established spatial patterns of growth and change in our two largest cities.
Despite the slowdown in Greater Perth’s population growth, it’s not all doom and gloom. The growth rate recorded in 2014-15 (1.6%) was still above the national average, and it’s clear from the table above that there were several LGAs in the top 20. Serpentine – Jarrahdale is located on the south eastern outskirts of Perth, and it’s growth rate of 7.2% is off a much smaller base than most of the other LGAs in the top 20 – it represented an additional 1,620 persons. Perth’s other usual suspects appear in the top 20, including Armadale, Kwinana and Rockingham, all located in the outer south.
The other interesting entries in the top 20 were Litchfield in the Northern Territory, and Walkerville, in inner Adelaide. Litchfield is a large municipality that surrounds the greater Darwin metropolitan area, and its growth reflects the popularity of rural residential living and new housing opportunities in towns such as Coolalinga, Howard Springs and Humpty Doo. Walkerville’s growth was a massive increase compared to the average over the last ten years, and is reflective of the apartment construction trend that is spreading beyond the City of Adelaide.
What areas are losing population?
Australia has more than 560 LGAs, many of them quite small in population size. In LGAs with less than 1,000 persons, relatively small adjustments to the population can result in large percentage movements. Just over one third of Australia’s LGAs recorded a loss of population in 2014-15. Overwhelmingly, the LGAs recording the largest decline in population were located in outback Western Australia. The Shire of Menzies in the east goldfields region recorded the largest population decline of -5.3%, but this represented just 21 persons and a 2015 population of 378.
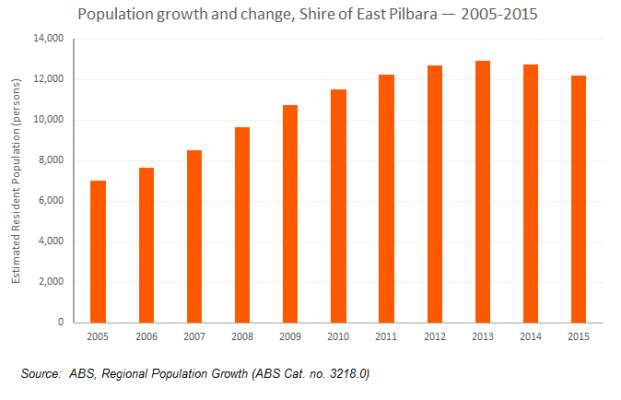
The only sizeable location to record substantial population decline was the Shire of East Pilbara in the Pilbara region (-4.4%). If you want a demographic representation of the mining boom and bust – this is the LGA for you. In the second part of the 2000s the Shire was generally growing by more than 10% per annum, and a peak population of 12,940 was recorded in 2012-13 (see graph below). Since that time the Shire has recorded population decline as labour requirements in mining areas have been scaled back, and the rate of -4.4% in 2014-15 represented 564 persons. Despite the economic output generated by mining operations, other LGAs in the northern part of WA either recorded little change to their populations or some decline, suggesting they too are feeling the impacts of the end of the mining boom.
Overall, LGAs located in inland Australia, particularly those with a resource or agricultural base, recorded population decline. In the case of agricultural regions this is continuing long standing trends associated with structural change, reduced labour requirements, drought and farm amalgamations.
For more information on this release, including numerous tables to download and explore, please refer to the ABS website.
If you want to learn more about which age groups are growing fastest in Australia, read our ebook: Three growth markets in Australia
.id is a team of population experts, who use a unique combination of online tools and consulting to help organisations decide where and when to locate their facilities and services, to meet the needs of changing populations.


Walkerville in Adelaide is an upper middle class suburb. it is surprising that the population trend is positive. From a traditional trend perspective the better off do not have large families as they can better afford contraception and aim to provide for better education to their children which costs more, therefor less children require less overall investment in education.
What is the sociological explanation from your end which is supported by evidence?
Thanks for your comment Leo. We were quite surprised by the figures for Walkerville as the rate and volume of growth is considerably higher than any time in the last ten years. I don’t think it’s anything to do with changes to the fertility rate, as it’s quite low. I believe it is to do with the construction of apartments ie more dwellings = more people. You would need to follow up with the ABS (as they produce these statistics) to get a more definitive answer.
Note that these numbers are preliminary and are subject to revision when the 2016 ERP data is released around this time next year, and then again when the 2016 Census data is released.
Walkerville has recently “enjoyed” a small boom in property development, particularly of high rise apartments, which is the likely explanation of these data. It is one of the last inner city suburbs to go through the “youth for oldies” cultural change partly because the larger older properties are tightly held and partly because it has very little land available for redevelopment. Walkerville council are also quite conservative so not likely to be that attractive to small scale developers (ie block splitters). It will be interesting to test my thesis by looking at the age patterns of Walkerville for the 2011 census vs the 2016 census when it eventually comes out. John (social health demographer)
Simone
Some corrections if I may regarding your post on population. The Shire of East Pilbara is in the Pilbara not Kimberleys and lest it be seen as reflective of the whole Pilbara, the other three LGAs Port Hedland, Ashburton and City of Karratha all had increases in population, a point which WA media failed to pick up on when also decrying the end of the mining boom. It needs to be said that whilst the construction boom in iron ore projects has peaked two of Australia’s biggest resource projects in history, the $55b Chevron Gorgon (2 LNG trains still under construction) and the $29b Chevron Wheatstone LNG projects are still under construction. Additionally record shipments of iron ore and LNG have come out of Pilbara ports in the last 12 months. When Gorgon and Wheatstone are fully online they will propel Australia into World no 1 for LNG production. The Pilbara continues to be the engine room of the Australian economy with mineral and petroleum sales of $77.6b (Nov 2015) and a combined GRP of $56.5b. The Shire of East Pilbara and City of Karratha are ranked 6th and 8th largest LGA GRP in Australia after Cities of Brisbane, Sydney, Melbourne, Perth, Gold Coast. So despite the “substantial population decline” East Pilbara has moved up to sixth place in Australian LGA GRP with a bigger output than City of Adelaide.These are hardly indicators of a mining bust.
Hi John,
Thanks for your comment. I’ve made a couple of minor adjustments to the blog in light of this. I do take your point about the GRP, however I think it’s pretty clear in the post that it’s written from a demographic rather than economic perspective. A 4.4% decline in population after massive increases in previous years is a turnaround in anyone’s language. I would also like to point out that although the councils you mentioned did technically record an increase in population, they are incredibly modest in light of previous years – 4 people in Ashburton is hardly an increase especially when they are estimates. It will be interesting to see if these trends continue in light of your comments, and of course the 2016 Census will provide a new population benchmark for analysis.
most of this is lack of state government laws and mayors who carenothing for growth, the cost of a village can be three times as much as what a city suburb even gets, . most rural council enjoy massive array of activites and infrastrucatul costs but very few even have anything above zero growth, even the amalgamated ones. just think hospital, high school grade school, libraries, parks reserves, ovals , playing fireld, bridges, roads, the ist goes on and no suburb i have ever seen has anyothing even close to thins what is enjoyed by a few. it is clear a criminla understanding as international laws are clear on the economic wealth and how it is to be used.
however as goes the lack of adeliade and northern territory are the tw owrst places in austrlaia and have only had 0.7 adeliade and 0.5 growth in the past few years as really no-one wants to live there, most of the time it is becuase the council themayor and the elected memebrs really dont care for resients they only care for agricultural in the cases listed above you mention mining dropped off.
however the places like bega at 4000 enjoy hospital, 8 schoold two type of supermarkets ,one coles one woolworths, and an array of really interesting stuff. of upper lachlan shire who was like most amalgamated. twenty years ago stillhas no growth it has stayed the same population, even though there are a few more houses,
it comes down to the govenment forcing the local government to have a growth index whic then forces the local government to inlcude spot rezoning of area where peopl ewould but the standard quarter acre or one arce of land , to live on or put their dream home on ,but thelocal governments dont care take far to long to process the application and are some o fthe highest cost in austrlia, whioe i watch hthem tlak the day away and waste more time thenanyone.
however some councils are really good like canden had an 7 per cent jump , in gorwth, and their are other places that need schools like south west rocks who has increased it population to 5, 313 within the kempsey shire form 18 000 to 28,000 in twenty years but the kids stillcatch a bus to go to high school 40 klms away. when i see the compete difernce in some area getting money it makes me angry. while others wit no growht are handed things.