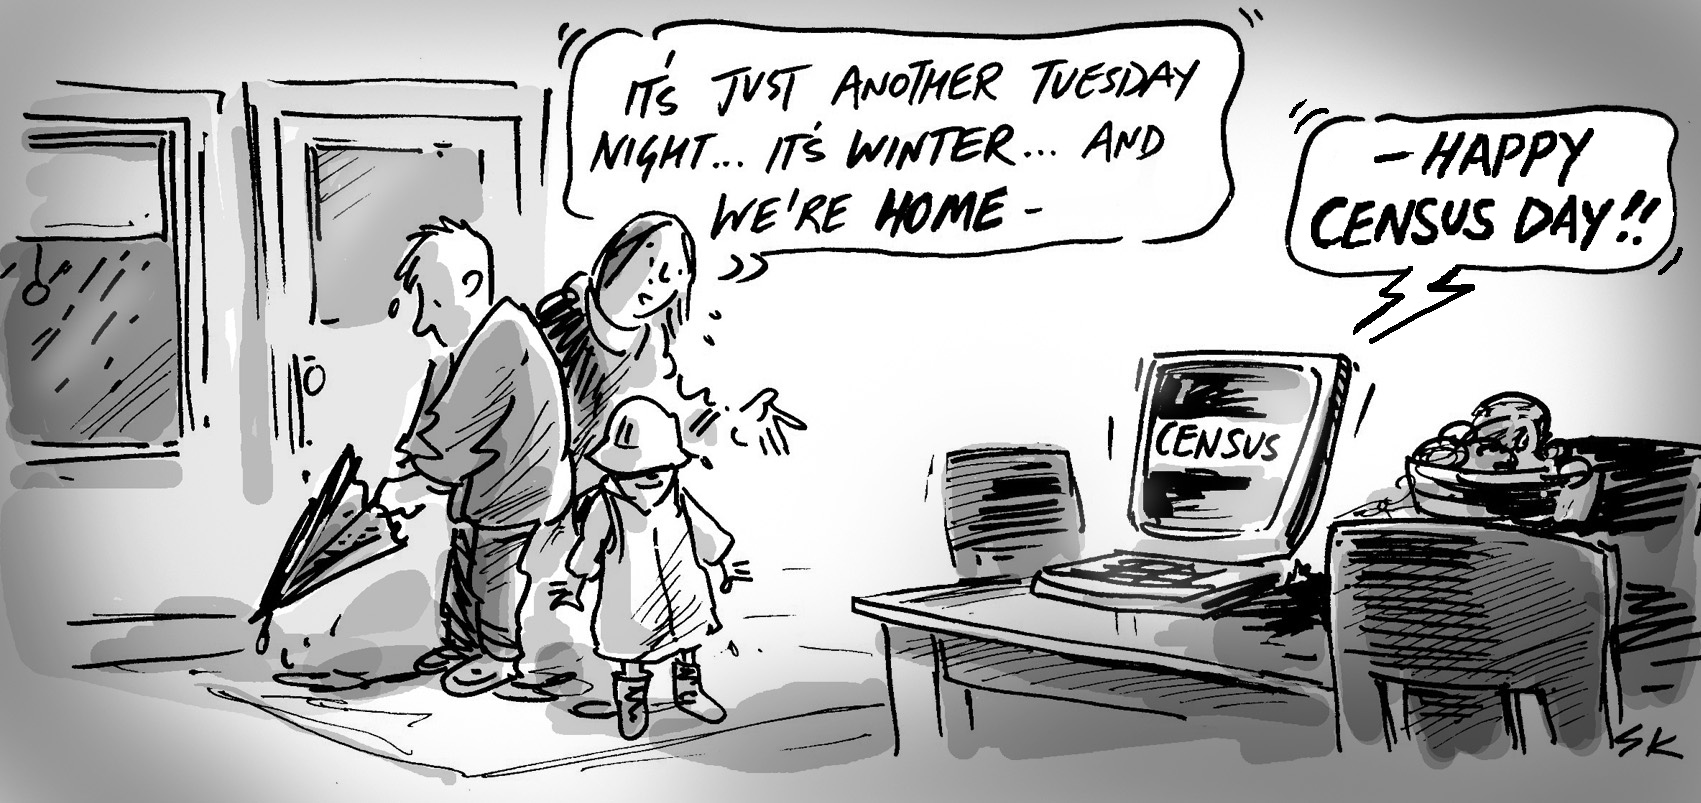
Tomorrow is Census day for Australia! It’s been many years since I first got my hands on a Census form – as a 10-year-old I was intrigued by the form which asked questions about everyone in the house, from how old they were, to what job they did, and, back then – what the outer walls of the house were made of. I actually filled in our Census form that year, mainly by asking my Dad all the questions and writing in the answers. Many years later I’m still intrigued by the Census, particularly the information it provides on a range of population issues, the puzzles it solves, and not to mention, the questions it raises.
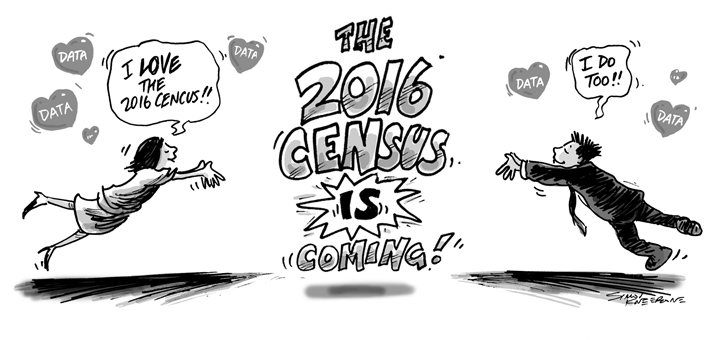
As someone who is a population forecaster and uses Census data on a daily basis, naturally I have a vested stake in the outcome. But not only does the information intrigue me, it informs my work and also provides id’s clients (amongst others) with the evidence base upon which to make planning decisions. So what am I most looking forward to when the results of the 2016 Census are released?
Just how quickly has the population grown?
The annual release of Estimated Resident Population (ERP) data at sub state level allows us to monitor population growth at smaller levels of geography. The further out from the last Census we get, the more ‘modelled’ the data becomes. Increasingly as forecasters we’re finding that it’s difficult for our forecast numbers to match the ERP, particularly in metropolitan areas.
Some of this is explained by methodology and counting units, but there is still a mismatch between the number of dwellings being approved, and the amount of population growth in Australia. This means that either there are dwellings that aren’t being counted, too many people being counted, or that there is a shift in the way people live in dwellings. We need more up-to-date data to help our understanding around this.
Are we changing how we live in dwellings?
One of the more intriguing aspects of the 2011 Census was the arrest in the decline of average household size. Nationwide, there was only a small decline in this variable, and in many areas average household size increased. Demographers typically explain declining average household size as a result of population ageing, and this is largely true.
However, the massive increases in net overseas migration since 2006 has tended to be young adults, who live in very different household arrangements. What further changes will we see in living arrangements? Will average household size start to decline again, or will it increase?
Vacant dwellings – more or less?
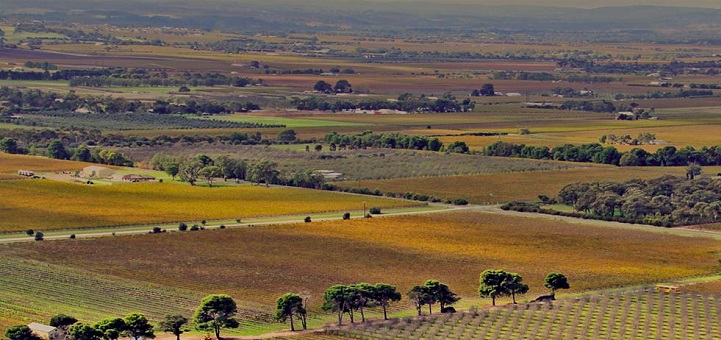
Successive Censuses have shown that the proportion of vacant dwellings in coastal and rural areas has generally declined. In 2006 this decline stopped in many areas, and in some more remote rural and coastal regions the proportion of vacant dwellings have started to increase again.
Many demographers have explained the decrease as retirees moving into their former holiday homes, and this assumption has been carried forward in many State government population projections when more recent data shows otherwise. Typically I find that higher State government population projections in coastal areas are a result of this ingrained assumption, when in fact the evidence shows otherwise. But will this trend continue in 2016?
Retirement migration
Usually retirement migration is inferred by age specific migration data in the Census e.g. flows of 55-64 year olds. In many high amenity coastal and rural areas, there is a spike in the number of people in the age group, indicating an in flow of retirees as many people do leave the workforce at this point in the life cycle.
With the slowdown in coastal growth, coupled with the arrest in the decline of household vacancy rates, I’m starting to wonder if the traditional retirement break from the workforce is a thing of the past. Already government policy changes to the pension mean that people of my generation need to work much longer, but other people are gradually withdrawing from the labour force e.g. reducing their hours, undertaking contract work. This would have the effect of delaying retirement migration until one is older, or even making it less feasible. For instance, the coastal holiday home may be retained as an income earner, rather than a permanent move.
Is the tide still out on coastal growth?
When the 2011 Census data was released I blogged about how coastal population growth had slowed (possibly related to the previous two points), and the evidence from the forecasts I’ve done since indicate that in some parts of Australia this still holds true e.g. Eurobodalla Shire.
The Census contains more data as to the drivers of these changes eg. vacancy rates, age structures and migration. It still surprises many people that coastal growth has slowed, after all, Bernard Salt did write a populist book called The Big Shift that was built around the premise of rapid coastal growth (though his version of “coastal” did include parts of metropolitan areas!).
How big are our homes?
Australia is said to have the largest new homes in the world as measured by floor space. While the Census doesn’t measure floor space (I wish it did!), there is the proxy measure of the number of bedrooms. This data is extremely interesting. For instance, in many parts of suburban Australia, there has been a decline in the number of homes with 1 or 2 bedrooms, and an increase in the number of those with 4 or more. This has occurred despite the large growth in high rise apartments with only one or two bedrooms.
Much of this shift can be explained by home extenstions, knock down and replace projects, and just simply larger homes being built on the suburban fringe. It goes a long way to explaining the increased size of our homes, loss of private open space and increase in dwelling footprint. It probably also explains part of the housing affordability issues in existing urban areas i.e. homes are bigger so they cost more.
Plain and simple mythbusting.
Possibly my favourite aspect of Census data is its mythbusting capabilities. There’s so much data that it can be weaved into many social discussions. I’m particularly intrigued by the amount of fear around Muslim immigration. In 2011 they comprised just 2% of the population, compared to 20% who had no religion. There are more Buddhists in Australia thanks to the large numbers migrating here from China in particular. I fully expect that there will still be more Buddhists than Muslims once the 2016 data is released.
Of course different religions have different spatial patterns of residential address and in some parts of Australia they do comprise a more substantial proportion of the population, but the same can be said about any ethnic group. And as I’ve blogged before, the much higher proportion of Australians who claim no religion I think says more about our society than the myriad of religions reported in the Census.
But overall I just love the Census for how it informs the story of urban and regional change in Australia. Will rural areas continue to decline in population? Which areas have turned around? What are the new coastal hot spots? What ethnic group has grown the largest? All this and more, when we all fill out our Census forms next week, and then when the data starts to be released from April 2017.
.id specialises in analysing, enhancing and presenting Census data. Access our community profiles and see how some of the results from previous Censuses relate to your local area: Community profiles for Australia and New Zealand.