New lines drawn around NSW highlight housing trends
In May 2016, the NSW government announced the first of a series of council amalgamations, including several in the Sydney metropolitan area. With .id working closely with the local government sector, there were obvious implications for our work.
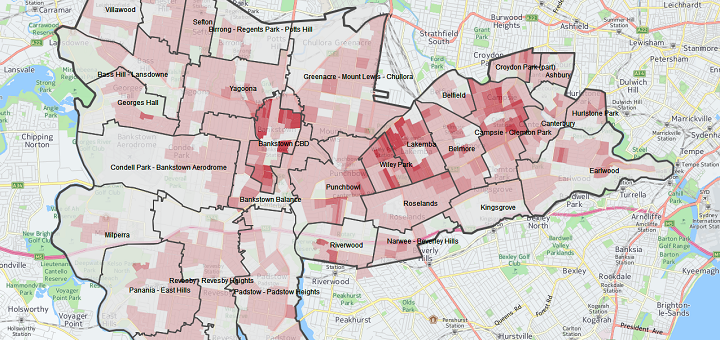
Having worked with many of these councils over a number of years, it was critical for us to not only maintain our relationships but also to provide councils with data relevant to their new boundaries. To this end, we’ve been proactive in preparing updates to our local government products on the new boundaries, publishing forecast information for The Hills in May 2016, and more recently for Parramatta and Cumberland. Cumberland was created via a merger of the former City of Holroyd, and parts of the Cities of Parramatta and Auburn.
So what did the data reveal?
As usual, the dwelling and household data for the forecasts were derived from the 2011 Census, and the population was based on the Estimated Resident Population (ERP). Because Cumberland didn’t exist in 2011, the population was estimated based on the ERP data published by the ABS at the SA1 geographic level. The new Cumberland area showed a 2011 population of around 203,190, with a forecast population of almost 297,000 by 2036.
Over the last few years, Sydney’s rate of population growth and residential construction activity has increased from the modest levels recorded in the 2000s and early 2010s. .id’s forecast team has consistently found higher rates of residential development for 2016 and 2017 when compared to 2012-15 – as if Sydney is playing ‘catch up’ in terms of housing supply. Higher levels of net overseas migration and reduced losses due to interstate migration, especially to Queensland and Western Australia, have also contributed to population growth and therefore the demand for new housing.
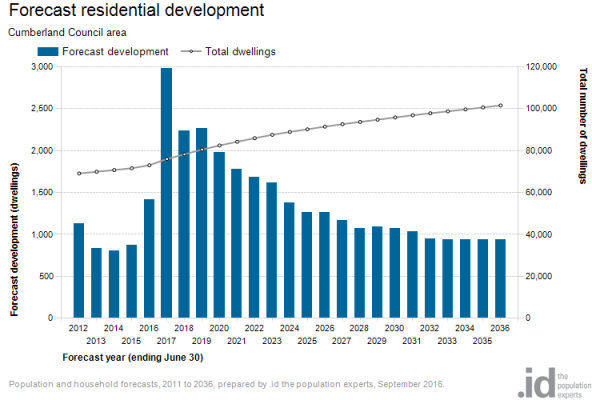
The new Cumberland Council is no exception to this trend, as shown in the graph below. The number of new dwellings added to the housing stock between 2012-15 was consistent with historic rates and primarily consisted of new apartment projects, infill development, and remnant greenfield residential development in Pemulwuy. Construction rates in the municipality increased in 2016 but are forecast to reach extremely high levels in 2017 when it’s assumed that almost 3,000 new dwellings will be completed. Many of these dwellings were under construction when the forecast was prepared, and there are also several additional projects in the pipeline that are assumed to be completed in 2018-2020. Again, this is well above historic levels. In the medium to long term, it is assumed that construction in the Parramatta Road Corridor will be realised, as well as new dwellings on older blocks and obsolete industrial land.
Where and why is all this development occurring?
Much of the development consists of apartment projects on obsolete commercial and industrial land close to railway stations. In some suburbs, such as Girraween and Wentworthville, older houses on large blocks are being demolished and sites amalgamated, in order to build apartment blocks of typically 20-40 dwellings. These are not huge projects compared with those closer to the CBD, but still are still a major departure from the historic settlement pattern of low density post-war suburban housing.
Cumberland Council not only has the advantage of being located adjacent to the City of Parramatta and its employment market but also has two major railway lines and good road links that provide easy access to the CBD and other parts of the Sydney metropolitan area. The spread of higher density development into Cumberland is a natural progression which is leveraging off what has occurred in Parramatta. Lastly, as we’ve mentioned over the years, apartments appeal to younger households seeking relatively affordable rental accommodation.
Spotlight on Wentworthville
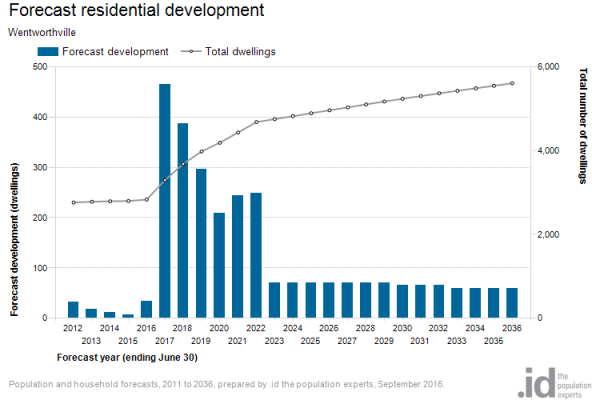
Wentworthville is located just two railway stations from Parramatta, a clear indication of its proximity to a major employment market, but with relatively affordable housing in the context of the Sydney property market. Wentworthville typifies the scale and type of development in Cumberland. Between 2012 and 2016, there were only two major developments constructed, but at the time of the forecast, there were more than ten developments under construction, with a similar number in the pipeline each year from 2018-2020. The grid pattern of the streets and large blocks with older housing, make it attractive for site amalgamation. In addition, the revitalisation of the town centre will increase the ‘pull’ factor for new residents. The graph below shows the assumed rate of residential development in Wentworthville over the period 2012-2036.
The rapidity of change in Wentworthville is demonstrated by development along Veron Street, which lies parallel to the railway line. There are eleven apartment projects assumed for completion over the period 2017-18. Typically these contain around 25-40 dwellings, and will represent a huge departure from the historic settlement pattern of separate houses with big back yards that existed until very recently.
You can find more information on the population forecast for Cumberland Council in forecast.id.
What else are we doing in this space?
At .id, we have several forecasts for new councils that are at various stages of preparation. In the coming months, users can expect new forecasts for Inner West, Northern Beaches, Georges River and Canada Bay-Burwood-Strathfield. Other forecasts that involve mergers of existing clients will also be updated progressively. We are excited to create new data for our clients that is useful, timely and relevant.
.id is a team of population experts, who use a unique combination of online tools and consulting to help local governments and organisations decide where and when to locate their facilities and services, to meet the needs of changing populations. Access our free demographic resources here.
Simone - Myth Buster
Simone has a rich background in human geography, demography and urban planning – a background that was useful in her previous roles in the Commonwealth and State Governments, and now as part of the forecast team at .id. From the Queensland coast to the southern suburbs of Perth, Simone produces population and dwelling forecasts that help local governments make informed decisions about future service and planning needs. She is a regular contributor to .id’s blog and has spoken at several conferences on how our cities and regions are changing. She is a big advocate of evidence-based planning and how Census and other data can inform this. Outside of work Simone is a keen traveller and photographer – interests that tie in well with her professional life and help her to understand “place”.