Forecasting the future of NSW: Where will population growth be located?
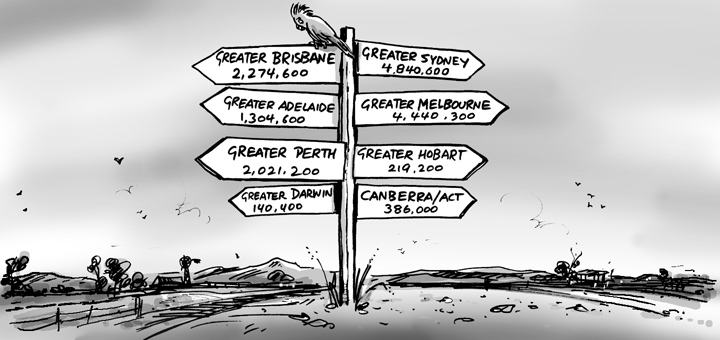
The population of New South Wales will grow by 1.927 million people in twenty years, making a state of 9.644 million people by 2036.
We often look to the big picture demographic trends to explain population growth. However, it’s important to understand these trends at a more localised level relevant to different geographic locations. This is because big picture demographic trends often play out in different ways across different local areas.
When we forecast the population growth of a state, we look to understand the local factors that are influencing ground-level growth, as well as the larger demographic trends at play. Drilling down to this sort of ‘small area’ level recognises the impact that land use and development has on the available amount and type of housing, which influences the population of an area.
.id use detailed knowledge of factors driving population change at the neighbourhood level to produce highly detailed population forecasts, which are used by governments and organisations to make informed planning and service-related decisions.
As we scratch below the surface of state-level population information, we begin to see different patterns emerge as we zoom in on the population of cities, regions and smaller suburban areas.
In this series of blogs, we use .id’s most recent Small Area Forecast information (.id SAFi) to examine future population trends across New South Wales.
To learn more about how population trends will unfold in New South Wales in the future, download our latest eBook: New South Wales: The return of the premier state?
Let’s begin with the first blog in this series, which examines where population growth will be in Greater Sydney…
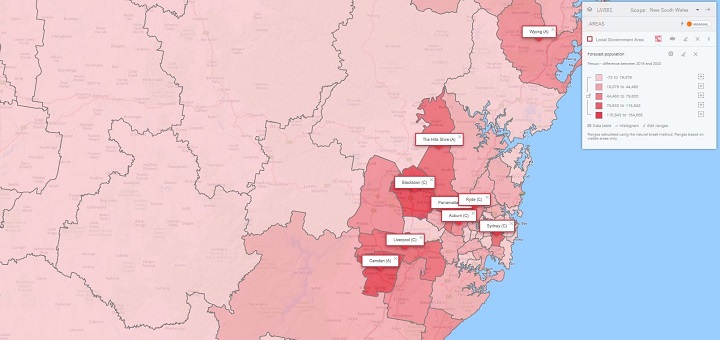
Where will population growth be located? Top 10 fastest growing local government areas in Greater Sydney
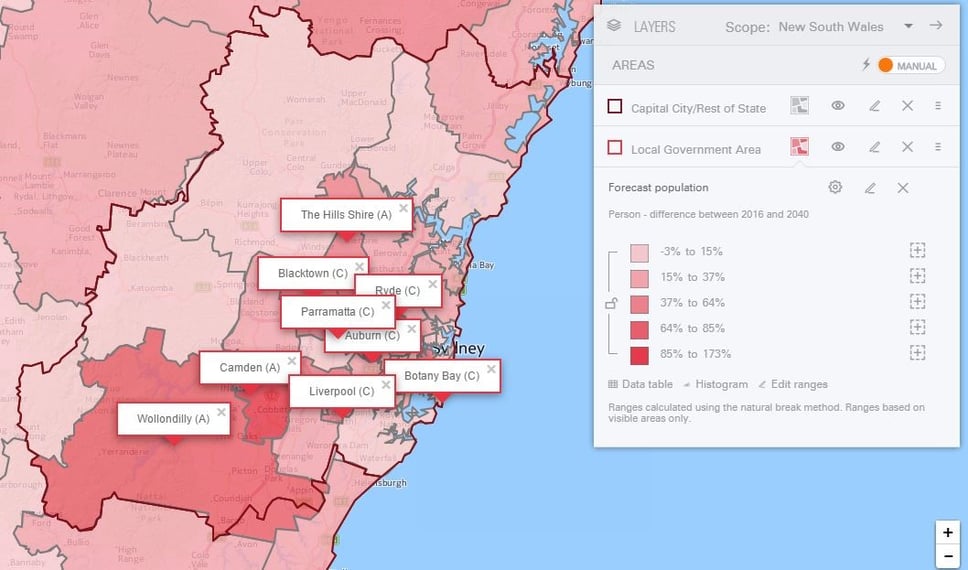
Greater Sydney’s fastest growing areas are located in the outer south-western and southern suburbs.
Blacktown will have the largest increase in population between now and 2040, with an increase of 154,700 people. As a percentage increase, however, it ranks 10th fastest with 45% growth.
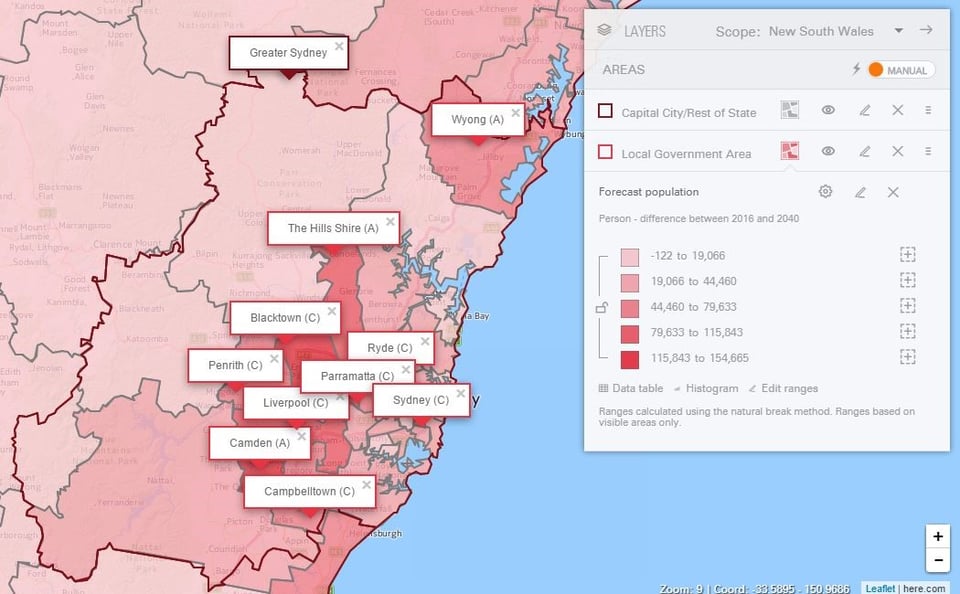
Greater Sydney’s top 10 fastest growing areas by absolute population growth between 2016 and 2040 are shown in the table below.
Top 10 local government areas with the largest population growth in Greater Sydney
Source: .id Small Area Forecast Information (SAFi), 2016
Camden will be the LGA with the 2nd largest volume of population growth, increasing by 137,700 people by 2040. It will also be, by far, the fastest growing LGA in percentage terms (172%). Camden’s rank is due in part to its relatively small population size in 2016, at least compared with the other local government areas expecting large volumes of growth in New South Wales.
Interestingly, Sutherland Shire (the second largest local area by population now), will lose its top spot between now and 2040 with only 12.5% population growth (28,500).
Top 10 local government areas in Greater Sydney with the fastest population growth
Greater Sydney’s top 10 fastest growing local government areas in percentage change between 2016 and 2040 is set out below.
Source: .id Small Area Forecast Information (SAFi), 2016
Of the top-three fastest growing local government areas, only Camden also features as an area with a high volume of population growth as well.
Auburn is an area with a population of 79,600, and will almost double by 2040, growing by 85.2%. Wollondilly currently has a population of 47,600 and will be the third fastest growing LGA by 2040.
While Blacktown is placed second in terms of growth by absolute number (and 10th in percentage terms), it is the most populated local area across all three time periods (2016, 2030, 2040) in Sydney and New South Wales. The City of Sydney has a similar trend placing at third largest by population in 2016 and second in both 2030 and 2040.
Why? We’ll explain how and why this growth will occur over the next few blogs in this series.
Note: Commentary and data included in this blog is for local government areas based on 2011 ASGS boundaries, which will be updated to 2016 ASGS boundaries to coincide with the .id 2016 Census data releases to .id Placemaker from mid-2017. For this reason, the recent LGA amalgamations and boundary re-drawings are not reflected in the analysis above.
To learn more about how population growth and demographic trends play out in NSW, download our latest eBook: New South Wales: The return of the premier state?
Esther - Team Forecast
Esther joined .id after working in the demography teams at both Statistics New Zealand and the Australian Bureau of Statistics producing national and regional statistics. Esther produces the top-down model for .id’s SAFi (Small Area Forecast information). This involves synthesising overseas, interstate and regional migration patterns to quantify regional change. Esther loves the way statistics assist in understanding our communities and can dispell urban myths or stereotypes.