Where is Australia’s renovation capital?
In 2014-15 financial year, Australians did $7.2 billion worth of renovation requiring approval, a figure which more than doubled since the year 2000. The popularity of TV shows like “The Block” and “House Rules” shows that renovating houses is a popular pastime in Australia, and a major industry. Where is Australia’s renovation capital?
For many established home owners, the option to renovate and extend an existing dwelling is more appealing than trading up to a larger house. This may be because it is too expensive to trade up in the same area, the home owner is particularly attached to the dwelling or location, or (as is increasingly the case) the stamp duty and other transfer costs of buying a new house would be cost prohibitive. In many areas of our capital cities, stamp duty alone can be $50,000 or more on an average priced dwelling, and that money may be better spent on renovating an existing house.
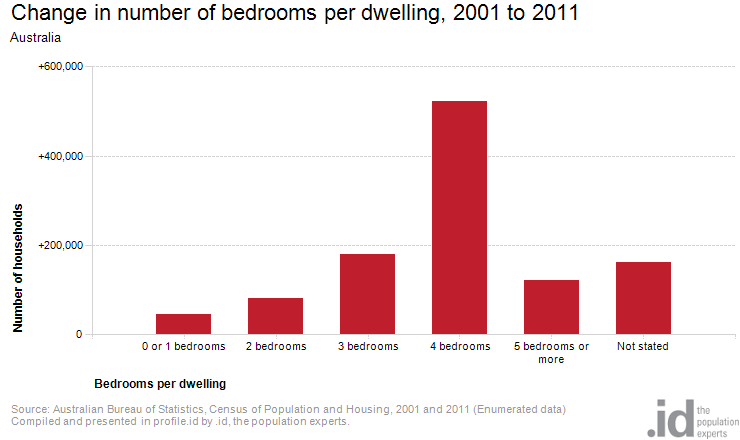
The 2011 Census showed that the largest increase in dwellings between 2006 and 2011 nationally was in the 4 bedroom category. In fact the increase in 4+ bedroom dwellings was higher than all other categories of dwelling combined. There is no doubt our dwellings are getting bigger over time. Partly this is because developers are building more 4+ bedroom new dwellings, but partly it is due to people adding bedrooms to existing dwellings via renovations.
Of course not all renovations entail adding a bedroom. The ABS building approvals collection includes a count of the value of building approvals which are related to new dwellings, compared to those which involve alterations to existing dwellings.
Renovations requiring a building approval generally include changes to the physical structure of the building – kitchen and bathroom renovations for instance, usually don’t, so they aren’t counted in the building approvals collection. Renovations which do may be adding a new floor, bedroom, extra living area, garage etc. So this dataset by no means includes all renovations, but it’s a good indicator of the larger, or more structural renovations.
In 2014-15 financial year, Australians did $7.2 billion worth of renovation requiring approval, a figure which more than doubled since the year 2000. As a percentage of total building activity, renovations have been fairly steady at around 15% of total approval value since the mid-1990s, having risen from around 3-5% in the 1970s. It seems that historically, renovation was something of a rarity – if you wanted to upgrade your house, you bought a new one. But in recent times, renovation and extension has become much more common.
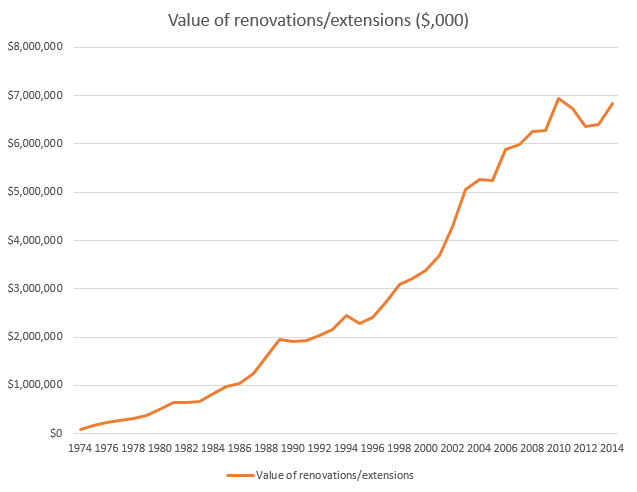
Source: ABS, 8731.0 – Building Approvals, Australia
This chart is not inflation adjusted, but even in inflation-adjusted terms, the value of renovations has approximately quadrupled since the early 1970s.
The table below shows renovations (or “alterations and additions including conversion”s, in ABS speak) by state, for the 2014-15 financial year. In absolute value, Victorians did more renovation requiring approval than any other state or territory in 2014-15, with $2.3b in renovations, or 11.6% of all building activity. Tasmania had the highest proportion of their activity in renovations, at 18.9%, but this only amounted to $110m.
| Building approvals split by new work and alterations/additions, 2014/15 | ||||
| State/Territory | New ($m) | Alterations and additions including conversions ($m) | Total Work ($m) | % alterations and additions |
| New South Wales | 15,690 | 2,135 | 17,825 | 12.0% |
| Victoria | 17,858 | 2,348 | 20,206 | 11.6% |
| Queensland | 10,865 | 1,267 | 12,132 | 10.4% |
| South Australia | 2,385 | 392 | 2,777 | 14.1% |
| Western Australia | 8,511 | 728 | 9,239 | 7.9% |
| Tasmania | 644 | 122 | 766 | 15.9% |
| Northern Territory | 554 | 90 | 644 | 14.0% |
| Australian Capital Territory | 1,121 | 107 | 1,228 | 8.7% |
At a regional level, the renovation capitals of Australia (the areas with the highest value of work going into alterations of existing properties) are mainly the well off inner urban areas of Australia.
Boroondara in Melbourne’s leafy eastern suburbs had the highest value of renovations in 2013/14, with $377m worth of work. This was closely followed by the North-Sydney-Mosman area on $314m, Victoria’s Mornington Peninsula ($238m) and Sydney’s Eastern Suburbs (including Waverley, Bondi, Woollahra and Vaucluse) with $223m. These areas all had high percentages of their total building activity in the renovations column as well, particularly Boroondara at 40%. But the highest in the nation was Leichhardt in Sydney, with 57% of all building activity being alterations to existing dwellings. This was followed by Moira in regional Victoria (50%), central Hobart (47%) and Unley, SA (46%).
| SA3 areas with the largest percentage of building approvals in the alterations category | Value of Renovations | % of total work in renovations |
| Leichhardt NSW | 32,859,000 | 56.9% |
| Moira Vic | 55,518,000 | 50.2% |
| Hobart Inner Tas | 97,884,000 | 47.6% |
| Alice Springs NT | 24,170,000 | 46.9% |
| Unley SA | 57,216,000 | 46.2% |
| Manly NSW | 45,700,000 | 43.4% |
| Fremantle WA | 119,969,000 | 41.1% |
| Broken Hill and Far West NSW | 6,238,000 | 41.0% |
| North Sydney – Mosman NSW | 321,337,000 | 40.5% |
| Pittwater NSW | 88,690,000 | 37.6% |
These areas are predominantly well off areas with few large redevelopment sites and no greenfield areas, or regional centres with relatively little new building happening. Where there is little opportunity to build new dwellings, residents are renovating existing ones. Housing prices may also be a factor. Sydney’s eastern suburbs and North Shore have among the highest housing prices in the nation. Having a high housing and land value means it’s difficult to over-capitalise – most renovations would be realised in house price appreciation – and also stamp duty makes changeover costs very expensive, so renovation is a more attractive option in these areas.
| SA3 Areas with the largest value of alteration/renovation approval, 2013/14. | Value of Alterations | % of total work in Alterations |
| Boroondara Vic | 392,928,000 | 20.2% |
| North Sydney – Mosman NSW | 321,337,000 | 40.5% |
| Mornington Peninsula Vic | 246,653,000 | 21.6% |
| Port Phillip Vic | 233,399,000 | 28.1% |
| Eastern Suburbs – North NSW | 230,384,000 | 20.5% |
| Yarra Vic | 216,756,000 | 20.2% |
| Bayside Vic | 216,672,000 | 22.6% |
| Sydney Inner City | 190,115,000 | 8.8% |
| Warringah | 188,129,000 | 32.2% |
| Brisbane Inner – North | 185,403,000 | 9.3% |
| Eastern Suburbs – South | 185,389,000 | 36.8% |
On the other hand, areas with a very low proportion of their total approvals in renovations include mainly areas with large redevelopment sites or greenfield housing developments. These include the City of Casey (Cranbourne Part), Victoria (1.8%), Blacktown-North (Kellyville Ridge-The Ponds part) NSW (1.5%) and Gungahlin, ACT (1.0%).
So renovation is certainly a large and increasing part of the building landscape in Australia, particularly in the parts of our capital cities with high housing values, but also in relative terms, in some regional locations.
Glenn - The Census Expert
Glenn is our resident Census expert. After ten years working at the ABS, Glenn's deep knowledge of the Census has been a crucial input in the development of our community profiles. These tools help everyday people uncover the rich and important stories about our communities that are often hidden deep in the Census data. Glenn is also our most prolific blogger - if you're reading this, you've just finished reading one of his blogs. Take a quick look at the front page of our blog and you'll no doubt find more of Glenn's latest work. As a client manager, Glenn travels the country giving sought-after briefings to councils and communities (these are also great opportunities for Glenn to tend to his rankings in Geolocation games such as Munzee and Geocaching).