How to create your own population pyramid
Everyone loves population pyramids. They are one of the most recognized demographic graphs and a really easy way to show the age and sex composition of a population. Most people would know that if it is pyramid shaped then the population is quite young, and if it’s coffin shaped, the population is old. We have one population pyramid on our profile sites, for single year of age, but they can be made with any of the 5 year age group or single year of age from any of our profiles or forecasts.

For this example, I’ve chosen to make a population pyramid for the forecasted 2030 population in the City of Mandurah, WA. You can export the data from the Population and Age structure page or through the data exporter.
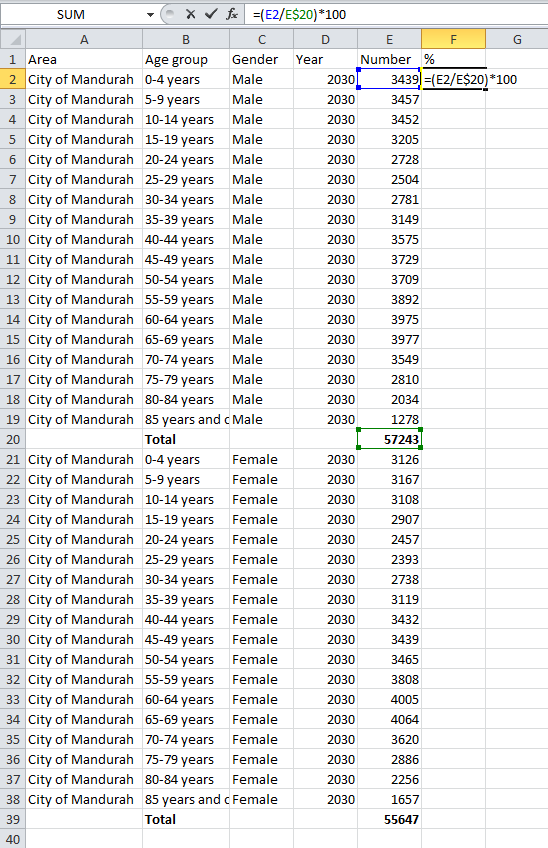
The first thing to do is add totals for the separate male and female populations. Then work out the percentages in each age group with the formula shown below.
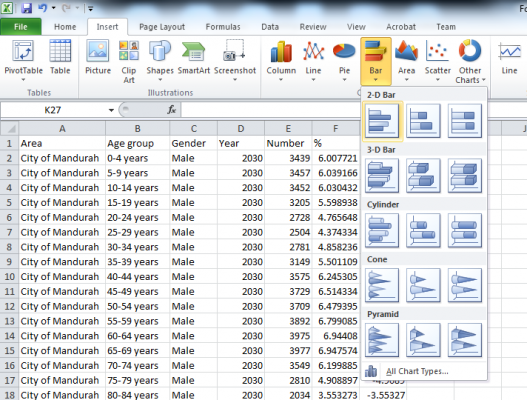
The next step seems a little strange, but is vital to the population pyramid looking right. Multiply the percentages of male population by -1. This will ensure they are on the left hand side of the chart (this is the tradition, I’m not sure why).

Now the data is ready, we can insert a 2D Bar chart.
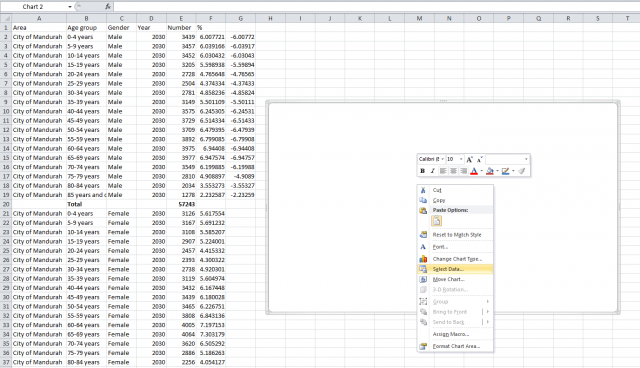
Right-click the chart area that comes up, and choose ‘Select Data’.
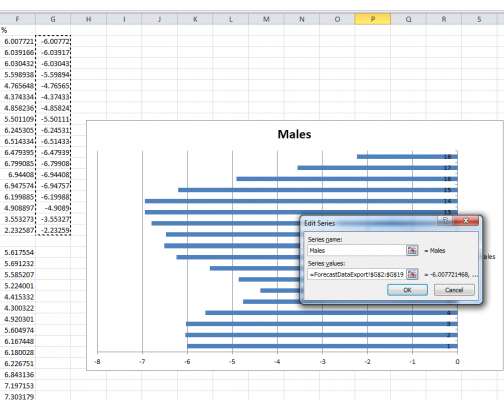
The box shown below should pop up, then click ‘Add’ under ‘Legend Entries’.

Put in the name of the series, in this case ‘Males’, then select the data.
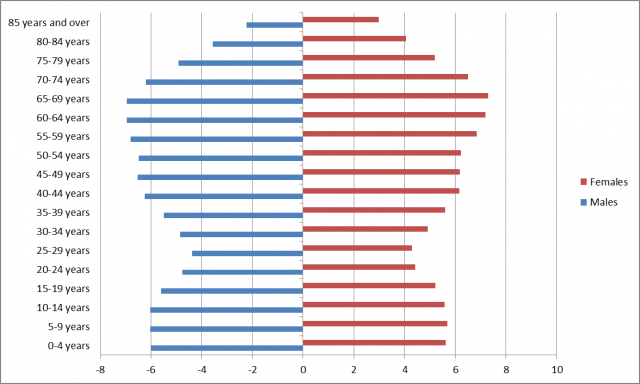
Repeat for the ‘Females’. Then for the horizontal axis labels, choose the age group labels as shown below. The graph that comes up doesn’t look quite right, but don’t worry, it soon will.
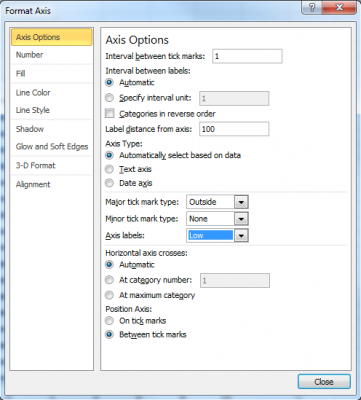
Double click on the axis that’s in the centre (I know, it’s a bit hard to see between the data bars). The ‘Format Axis’ box shown below should pop up. Under ‘Axis Labels’, choose low. This will move the Age labels to the left hand side.
Almost there… The next step is to double click on one of the data bars. This will open the ‘Format Data Series’ box, where in ‘Series Options’, change the ‘Overlap’ to 100% and the ‘Gap Width’ to 0.
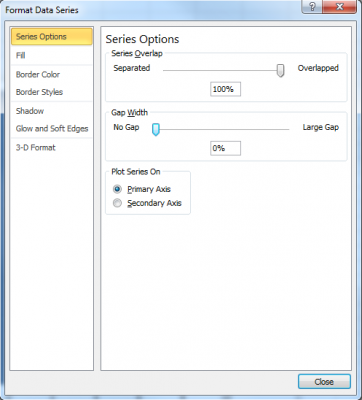
While you’ve got that box open, put a border around your data bars so they’ll be distinguishable. You’ll need to repeat this for the other data series.
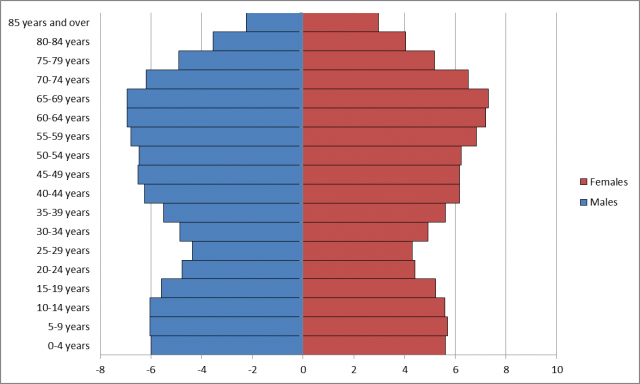
Now the graph looks pretty much right. The last thing to do is get rid of the negative numbers on the bottom axis. Double click on the axis, then in the box that pops up, select ‘Number’. Under ‘Category’, choose ‘Custom’ and in ‘Format Code’ type 0;0, then press ‘Add’.

Now you have a population pyramid! You can of course now add titles and change colours etc.

If you found this blog helpful, you’ll find lots more tips and tricks in the “how to” section of our blog, or visit .id’s YouTube channel to find our growing series of training videos.
You might also like to leave us a comment below about other topics you would like help with…
Georgia Allan
Georgia completed a Masters in Population Studies and Demography at Flinders University in Adelaide. At .id, Georgia is a consultant in .id's housing team. She was heavily involved in the creation and continued development of housing.id, the online tool developed to give councils an accessible evidence base for planning and advocacy. Georgia has prepared housing demand and supply analysis for a range of councils, including those in inner-city, middle ring, growth and peri-urban areas. When not in the office, she is likely to be cooking, knitting, crocheting, or buried in a good book.