Australia’s birth rate falls to the lowest in a century
The ABS has just released the count of births and birth rate for the 2019 calendar year, recording a significant decrease in the nation’s birth rate. In this blog, Glenn explores Australia’s historic birth rate, the age at which we’re having babies and the implications of these changes.
In 2019, Australia’s birth rate (total fertility rate) fell to a record low of 1.66 babies per female.
The number of babies born in any place is one of the most important demographic indicators. Natural increase (excess of births over deaths) is the most fundamental way any human population grows – but in Australia it typically makes up only about one-third of population growth, with the rest comprising overseas migration.
All data here are sourced from the Births, Australia publication at the ABS website.
What is the birth rate and replacement level?
The total fertility rate (TFR; commonly known as the birth rate) can be thought of as the average number of babies a woman will have over her lifetime, if the prevailing age-specific fertility rates in a given year applied over her whole lifetime. Obviously no one has 1.66 babies, but this is an average! And that number, Australia-wide, is the lowest it’s been in the last century, for which we have accurate records.
“Replacement level” is generally considered 2.1 babies per female – ie. replacing the two parents, with a small extra factor for infant mortality. Infant mortality is very low in this country, so the actual replacement level is probably more like 2.05, but 2.1 is still widely used as the mark for replacement level.
Is Australia’s population going to decline because of the low birth rate?
There is a bit of a myth that because we are below replacement level, the population would be in decline without overseas migration. In fact, despite such a low birth rate, the population would continue to increase for some time on its own. This is because there is still a large cohort in child-bearing age groups.
There were still a total of 305,832 births registered in 2019. This is the lowest number since 2014, but is still very high compared to the number of births recorded even during the Post WWII baby boom of the 1950s – simply because our population is much higher.
The number of births for 2019 is also nearly double the 169,301 deaths recorded in the same year – so we’d still be growing, albeit at a slower rate, without migration. It would take a generation for this to “catch-up” and for Australia to have a natural decline (like Japan does at the moment) in the absence of other factors. Of course there may be other factors, and we could experience population decline if there is a negative net migration (ie. more people leave Australia than enter). With no overseas migration into Australia at the moment, this is a possibility.
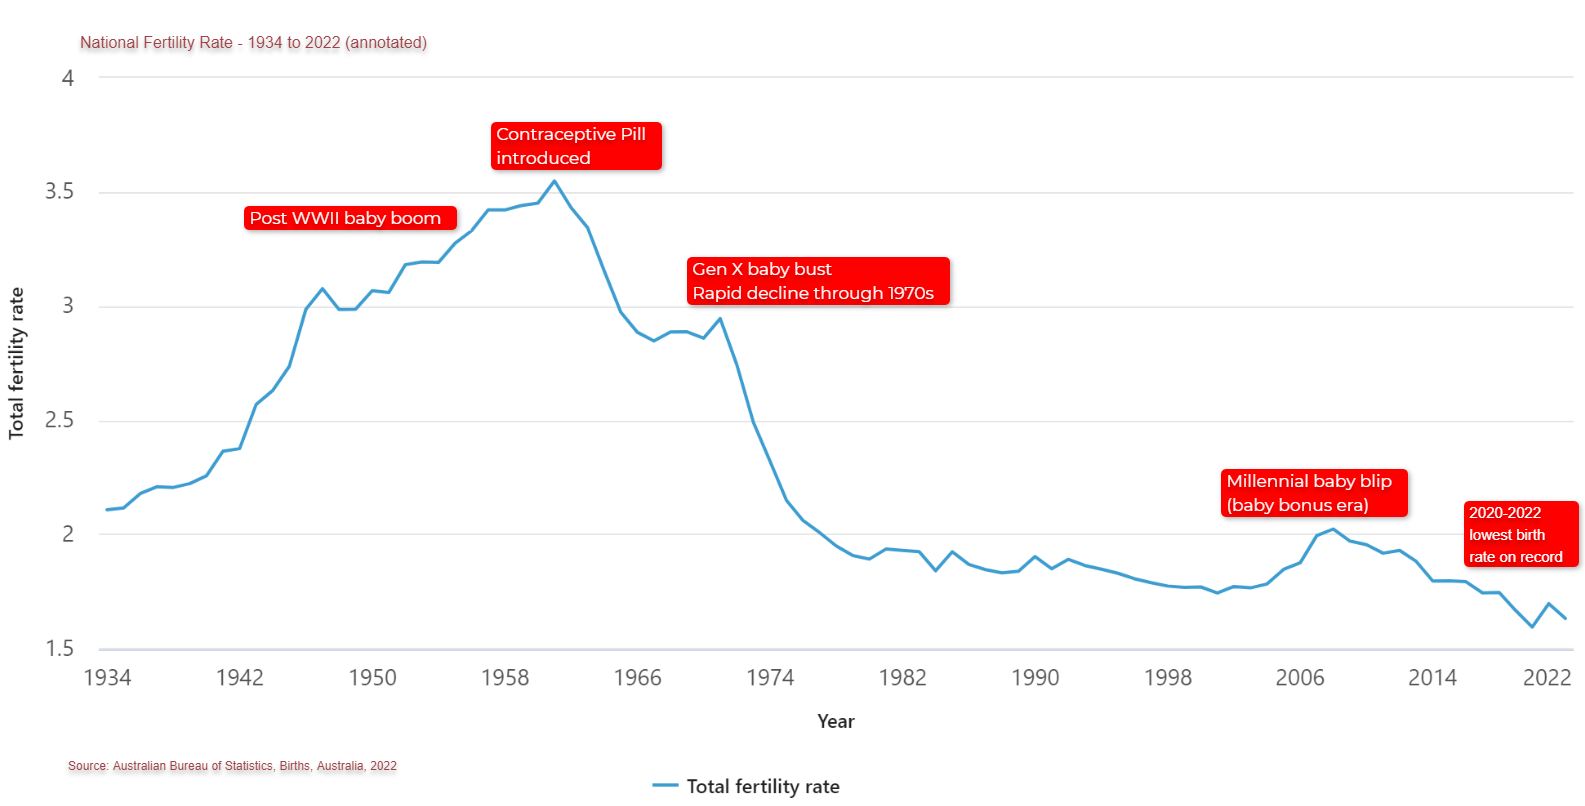
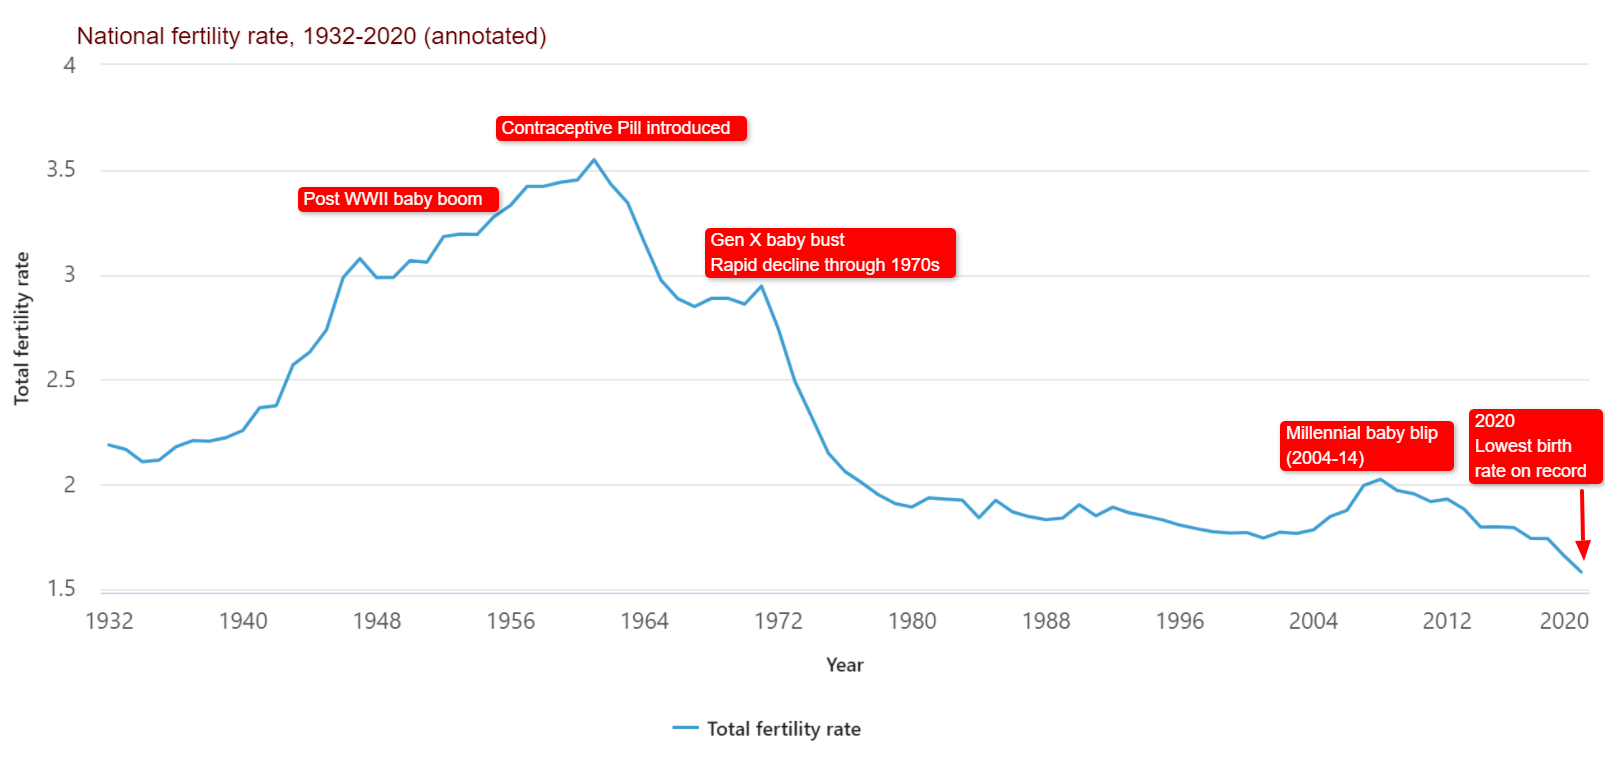
Australia’s fertility rate over time
This chart, taken from the ABS website (annotations by me) shows the various trends in the birth rate over the past 75 years in Australia.
.png)
It was only a few years ago that we were talking about the large influx of children from the millennial baby blip. This occurred between about 2004 and 2014, peaking in 2008-09 – and coincided quite closely with the availability of the baby bonus to new parents. You can see that in the demographics at the moment, with the peak baby blip kids now swelling the numbers in our secondary schools. But that’s soon to taper off, and primary schools in many parts of the country would be experiencing declining enrollments currently and for the next few years. This is similar to what happened in the 1980s when many schools were closed (when the fertility rate fell below 2.0 from the chart above).
How do birth rates differ within Australia?
The birth rate also varies by state and, of course, by regions within states. Regional differences in birth rates is a topic for another blog, but these are a really important assumption which feeds into our population forecasts. As a general rule, more rural areas have higher birth rates, as are outer suburbs with housing growth on the fringes of our cities, while established and particularly inner urban areas are lower.
Total Fertility rate by State/Territory – 2009-2019
Source: Australian Bureau of Statistics, Births Australia – 2019
At the state and territory level, Victoria has the lowest birth rate, at just 1.53 babies per female. The Northern Territory, with its more remote population and high Indigenous population (Aboriginal and Torres Strait Islander populations have statistically higher birth rates) has the highest birth rate. But even the NT only reaches 1.84 – still well below replacement level.
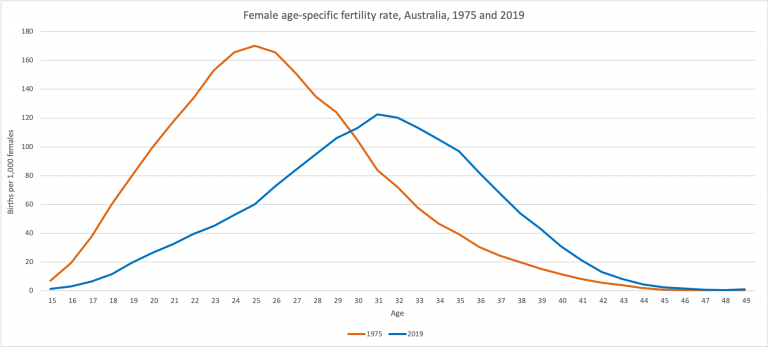
At what age are women having babies?
The other major trend, which has been going on for more than 50 years now, is that the age at which women have children has been getting older. High fertility has shifted from the early 20s into the 30s, with the largest relative increases among mothers aged 40+. The peak age for having children is now 31, but that has been the peak every year since 2002. There is, of course, a biological limitation how much later peak fertility may get. Nevertheless, as the chart shows, the shift is quite profound, when comparing 1975 to 2019. Basically, we are having kids much later in life than previous generations.
Do we know the impact of COVID-19 on birth rates?
Of course this dataset is for the calendar year 2019 – which means it’s all pre-pandemic and everything that’s happened this year. Dare I say that birth rates were already at an unprecedented low level before COVID-19 struck? There has been much speculation about birth rates potentially skyrocketing 9 months after lockdown. While we don’t have the figures in yet, this seems quite unlikely, and .id’s population forecasts continue to factor in a lower birth rate. If anything, economic uncertainty usually acts to bring the birth rate down, regardless of how long people are locked up for! So we predict further declines here, but we’ll just have to wait and see what the data tells us.
Glenn - The Census Expert
Glenn is our resident Census expert. After ten years working at the ABS, Glenn's deep knowledge of the Census has been a crucial input in the development of our community profiles. These tools help everyday people uncover the rich and important stories about our communities that are often hidden deep in the Census data. Glenn is also our most prolific blogger - if you're reading this, you've just finished reading one of his blogs. Take a quick look at the front page of our blog and you'll no doubt find more of Glenn's latest work. As a client manager, Glenn travels the country giving sought-after briefings to councils and communities (these are also great opportunities for Glenn to tend to his rankings in Geolocation games such as Munzee and Geocaching).


