The millennial “baby blip” is now over
Whenever we’re talking about the big-picture demographic story in Australia, the graph below showing a millennial ‘baby blip’ will usually make an appearance. Now, Glenn writes, we can say the baby blip is over.
We’ve been talking for a while at .id about how birth rates increased during the early part of the 21st Century. This increase in babies born in Australia has lead to a recent influx of children into our schools, both primary, and now secondary schools just in the last couple of years.
The birth rate is measured by what’s called the “Total fertility rate”, or TFR. It’s an age-adjusted measure that allows comparison between areas, and represents the number of babies a woman can expect to have over her lifetime – if her lifetime was covered by the current fertility rates which existed in the given year.
This chart, courtesy of the ABS, with annotations by me, shows how the TFR has changed over the past 70 years in Australia.
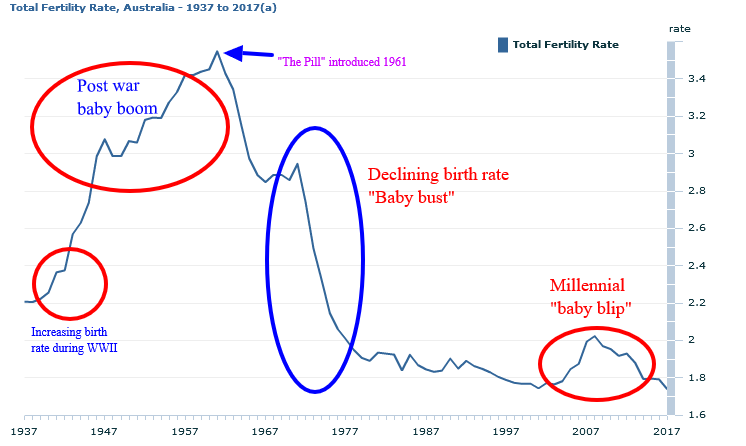
Source: ABS, Births, Australia, 2017 (3301.0) – See the original here.
As you can see, the generation that we call the “baby boomers” were born during a time of high fertility rates, with average babies per woman over 3. This ended after the introduction of The Pill in 1961, giving rise to “Generation X” and then increasing participation of women in the workforce during the 1970s drove the birth rate down to levels around 1.8 to 2, where it has been sitting ever since. The exception was the time from about 2003 to 2012, which we call the “baby blip”, when fertility rates increased sharply again.
Though the peak of this blip was much lower than the baby boom, the actual number of births was much higher, peaking first in 2012, at 309,600, then again in 2016, at 311,000. Though the rate may be lower, there are a lot more people in Australia now (due largely to migration), so there are more babies being born.
What’s interesting is that in just the last year that we have data for, 2017, the TFR has now slipped to 1.741 babies per woman, which is just very slightly below the previous low point, in 2001, at 1.743, making it the lowest fertility rate ever recorded in Australia. At the 2008 peak, just 9 years earlier, TFR reached 2.02 babies per woman – almost replacement level. Replacement level for births is generally regarded as 2.1, which is the replacement of both parents, with an allowance for infant mortality. It’s likely that replacement level is actually a bit lower now, as Australia’s infant mortality is extremely low.
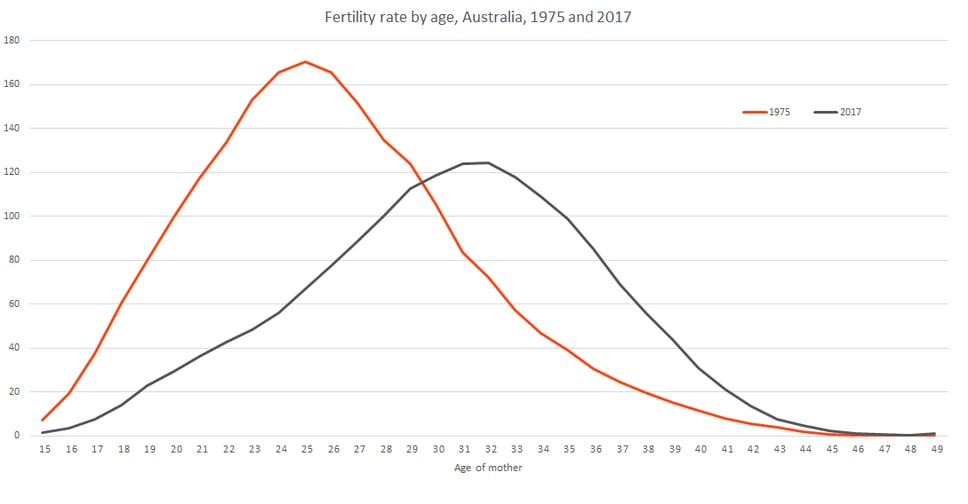
The other interesting thing about the change in birth rate is the age at which we are having children. This has changed dramatically over time. The overall fertility rate in 1975 was not much higher than 2017. But fertility peaked among women in their mid-20s and declined after that. Now the average age for mothers is around 32, and we’ve seen large increases in fertility among those in their late 30s and early 40s, with big declines in teenage mothers and those in their early 20s.
So what caused the millennial baby blip?
Well, some might say it was the government’s “baby bonus” which did seem to coincide with the start of the increase in 2003, when Peter Costello famously asked Australians to have “one for mum, one for dad, and one for the country”. I commented on this at the peak of the boom in 2011, and you can see my thoughts in the older article here.
Whatever the reasons for the baby blip, it’s well and truly over now. But we still have close to a record number of births each year. High migration continues to fuel Australia’s growth too. Even without migration, it would be 30 years or more before Australia’s population would start to decline due to low fertility rate, the way Japan’s is at the moment.
Fertility also differs markedly between areas. Growth suburbs on the urban fringe have higher birth rates than the city centre areas. But rural areas tend to have the highest rates of all. This has a big impact on your future population, and forecast.id takes these geographic differences into account. It has specific birth rates assumed for each small area, which gives you a great view of exactly what’s happening in each place within your region.
If you’re curious about the age structure of your local population, or would like to see forecasts for different age groups in the future, you can access demographic profiles and population forecasts for hundreds of council areas across Australia and New Zealand via our demographic resource centre.
Glenn - The Census Expert
Glenn is our resident Census expert. After ten years working at the ABS, Glenn's deep knowledge of the Census has been a crucial input in the development of our community profiles. These tools help everyday people uncover the rich and important stories about our communities that are often hidden deep in the Census data. Glenn is also our most prolific blogger - if you're reading this, you've just finished reading one of his blogs. Take a quick look at the front page of our blog and you'll no doubt find more of Glenn's latest work. As a client manager, Glenn travels the country giving sought-after briefings to councils and communities (these are also great opportunities for Glenn to tend to his rankings in Geolocation games such as Munzee and Geocaching).