Movement in and out of Australia: who, why and how many
The Census of Population and Housing is probably the most well known demographic data set released by the ABS, but there is a wealth of other data released which tells us how the Australian population is changing. Each month statistics on Overseas Arrivals and Departures (OAD) are released. This data is primarily collected via passport movements, visa applications and passenger arrival cards and it’s one of the inputs into the calculation of net overseas migration. Not only does the OAD data tell us how many people are entering and leaving the country, but you can also find out why they travel and where to/from. What does the latest data tell us?
Long term movement dominates migration into Australia
Migration is considered the most volatile of the components of population change and the chart below confirms this. It shows the number of permanent and long-term arrivals into Australia since 1976 – note that these are counted as movements.
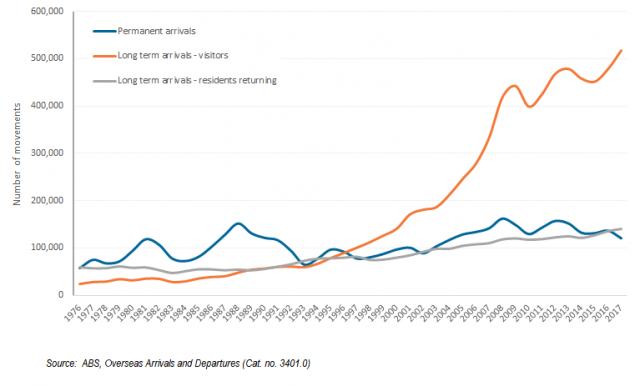
Annual movements are volatile and often related to economic conditions – when permanent arrivals are considered, there is a clear downward trend during times of economic recession such as the early 1990s. However the dominant trend shown here is a very large increase in the number of long-term arrivals since the turn of the century. Long term arrivals are typically people of various visa types (for example, students, skilled labour and others who intend to stay in Australia longer than 12 months).
This is part of a wider global trend whereby people are becoming far more mobile. In 2015, the United Nations estimated that over 244 million people lived outside their country of birth. Again, much of this is related to economic conditions such as people following jobs around the world, perhaps residing in a country for only a few years rather than moving permanently.
Short term movement – why come to Australia and for how long?
Like many countries, Australia has a passenger movement card which is filled out by people arriving in the country. Those little slips of paper that take around 5 minutes to complete towards the end of your long plane journey are a primary source of data for the OAD collection. You might have noticed that visitors to Australia have to say why they are coming here and for how long. There were around 8.8 million short-term arrivals in Australia in 2017. Very short trips dominate, with around 56% of movements lasting up to 2 weeks, and around 76% up to one month.
In terms of the reason for travel, around half of short-term arrivals are in Australia for a holiday, and another 27% come to visit family and/or friends.
The length of stay data and reason for visit data were very similar in 2007, suggesting that there has not been a huge shift in the length and types of short-term arrivals into Australia over the last ten years. However, it is important to note that the number of short-term arrivals was higher in 2017 compared to 2007. The main difference was in the proportion coming for conferences and business – 14% in 2007 and 11% in 2017 – despite a slight increase in the actual number of movements.
Where do Australia’s visitors come from?
The table below shows the main source countries of short term visitor movements (arrivals) to Australia from 1997 to 2017. Over the twenty years, the number of short-term movements doubled from 4.32 million to 8.81 million but there were also significant changes to the countries of origin.
Source: ABS, Overseas Arrivals and Departures (Cat.no. 3401.0)
Unsurprisingly, a significant proportion of short-term arrivals are from neighbouring countries and parts of Asia. In 1997, Japan was the main source country for short-term arrivals but by 2017 the number of movements had halved, such that they were the fifth-ranked source country. In contrast, there were significant increases in the number of short-term arrivals from most of the other main source countries.
The most notable example is China, which almost pipped New Zealand to take the top spot in 2017. In 1997, short-term arrivals from China was less than 66,000, but by 2007 this had increased to 354,700 – a more than five-fold increase! The increase between 2007 and 2017 was another four fold, to almost 1.36 million.
This reflects growing economic and social ties between Australia and China, but also improved access through the increase in the number of direct flights from several cities in China. On the other hand, economic and social ties between Australia and New Zealand have always been important, and the steady increase in visitor arrivals from that country reflects this. Residents of both countries can also move relatively easily between the two which also facilitates high volumes of movement.
Where do Australians travel to?
The table below is similar to that above but shows the reverse movement – in which country Australian residents spent their time overseas. This data is not available for 1997 and 2007. It’s important to note that this refers to the main country of stay so doesn’t reflect all travel undertaken. For example, I recently spent time in both New Zealand and the United States, but because I spent more time in the latter, that’s the country that gets counted in these statistics. This also influences the numbers in European countries where many Australians travel to, as it’s not unusual to visit more than one country while in that region.
| Rank | Country | Number |
| 1 | New Zealand | 1,422,600 |
| 2 | Indonesia | 1,180,200 |
| 3 | United States | 1,078,000 |
| 4 | United Kingdom | 630,700 |
| 5 | Thailand | 582,200 |
| 6 | China | 536,200 |
| 7 | Singapore | 405,900 |
| 8 | Japan | 395,600 |
| 9 | India | 362,300 |
| 10 | Fiji | 347,100 |
| Total all movements | 10,530,900 |
Source: ABS, Overseas Arrivals and Departures (Cat.no. 3401.0)
The three major countries (of main stay) for returning Australian residents are New Zealand, Indonesia (most likely Bali) and the United States. Together, they comprise about one-third of all return movements by Australians. As mentioned above, there are very strong economic and social ties between Australia and New Zealand, but the other main destination countries reflect proximity (in a global sense), affordable air travel and more direct flights. For Australia, the importance of direct flights cannot be underestimated – we spend so much time travelling to other countries that a direct flight can influence the number of visitors quite significantly.
For instance, the increased number of Australians travelling to Japan has steadily increased this decade, such that at current trends, the number of Australians visiting that country will outnumber those coming here – a huge turnaround from the 1990s. This has been facilitated by Qantas introducing direct flights between Melbourne and Tokyo and as well as Japan Airlines expanding its presence in the Australian market.
So how does this influence population trends in Australia?
Obviously permanent and long-term arrivals to Australia are included in the Estimated Resident Population (ERP), but the importance of short-term arrivals should not be underestimated. Many migrants to Australia start their journey on short-term visas, transferring between visa types with an eventual aim of gaining permanent residency. For instance, there were more than 500,000 visitor arrivals in 2017 who stated that their main reason for travel was education – an indication of the importance of the overseas student market in Australia.
Many of these may wish to remain in Australia when they complete their studies, but to do may take many years and significant bureaucratic hurdles. The relative ease with which New Zealanders can move in and out of the country also influences the ERP – Australians also influence the New Zealand population when the move is made in the opposite direction. The ABS provides a list of reasons to which these data are put. The reality is that we live in times of increasing personal mobility, and migration moves, whether they be short term or long term, will continue to influence population trends in Australia and across the world.
.id is a team of population experts who combine online tools and consulting services to help local governments and organisations decide where and when to locate their facilities and services, to meet the needs of changing populations. Access our local government area information tools here.
Simone - Myth Buster
Simone has a rich background in human geography, demography and urban planning – a background that was useful in her previous roles in the Commonwealth and State Governments, and now as part of the forecast team at .id. From the Queensland coast to the southern suburbs of Perth, Simone produces population and dwelling forecasts that help local governments make informed decisions about future service and planning needs. She is a regular contributor to .id’s blog and has spoken at several conferences on how our cities and regions are changing. She is a big advocate of evidence-based planning and how Census and other data can inform this. Outside of work Simone is a keen traveller and photographer – interests that tie in well with her professional life and help her to understand “place”.