National migration series | Part 2: Understanding incoming migrants
In part two of our National migration series, we begin to explore the nuances of inbound migration, to help you understand how the mix of inbound migration affects how migration is likely to affect the future population of your place.
Who is included in migration figures?
Migration numbers are at an all-time high!
The media has been broadcasting this message for the last few years. And it’s true! Yet what causes that volatility is a head-scratcher.
A positive shift in net migration is generally seen as an indication of how well the economy is doing. However, even our leading banks are having a hard time linking current economic conditions to net migration estimates …and that’s just looking at the short-term future.
Westpac thinks net migration will stay at current levels for next few months, before dropping to around 60,000 annual gain and around 45,000 by the end of the 2018 Calendar year (Westpac New Zealand, 2017).
On the other hand, ASB forecasts net annual migration gains to stay above 70,000 well into 2018 (ANZ Bank, 2017). Between the Westpac and ANZ forecasts, we have a variance of around 25,000 at the end of next year. This difference illustrates the struggle of forecasting migration.
Permanent and Long-term (PLT) figures capture all migrants coming in or moving out of the country for a period of 12 months or more.
Incoming migrants are therefore just one part of the puzzle and they have various reasons for travel, which are reflected by their visa types.
There are five categories of PLT arrivals. The changing contribution of each is shown in the graph below;
Immigration figures for permanent and long-term arrivals by visa type – Year ending June 2017.

Source: Statistics New Zealand
Notably, the number of immigrants on work visas has doubled in the last decade and, more recently, there has been a sustained increase in the numbers of New Zealanders returning home and Australian citizens crossing the ditch. The volume of residence visas has remained relatively stable, as have visas for visitors.
What does this mean for planning?
For planners, a major point to take from this breakdown is that a surprisingly low number of PLT immigrants are here for the long-term.
For example, while close to one-in-five arrivals are international students (18.2%), “long-term” in their case means the period of their study. Work visas are the same. So we can expect half the 2017 PLT immigrants will return to their home country, unless their visas are extended or they transition onto another kind of visa.
Statistics New Zealand note, however, that there is a tendency to transfer to another type of visa, and so argue it “makes sense to count long-term stayers as part of our population, rather than as short-term visitors” (Nolan, 2017).
The fact remains that the overall PLT numbers must be translated into a lower ongoing cumulative change.
Finally, internal migration is heavily weighted towards young working-age people – particularly those between 20 and 30 years old.
Comparing arrivals with overall age structure
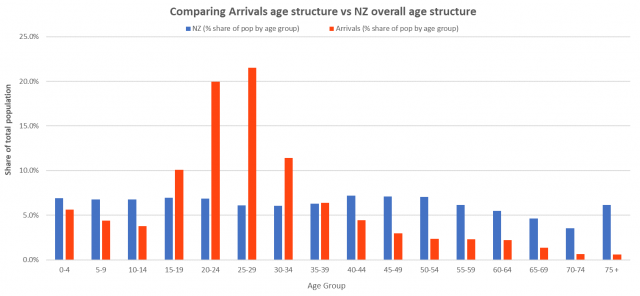
New Zealand’s population is ageing, so the injection of younger people has a positive effect on the age structure of the population, rather than simply increasing the overall size of the population. However, this influence is tempered by outgoing migrants who exhibit similar age characteristics.
Read Part 3: The link between departures and arrivals
.id is a team of population experts, who use a unique combination of online tools and consulting to help organisations decide where and when to locate their facilities and services, to meet the needs of changing populations. We provide free resources to help you make the most of demographic data. Access .id’s demographic resources here.
References
ANZ Bank. (2017, May). Reports – Economic weekly. Retrieved from ASB: https://www.asb.co.nz/content/dam/asb/document/reports/economic-weekly/economicweekly_010517.pdf
Nolan, P. (2017, August). National population estimates: At 30 June 2017. Retrieved from Statistics New Zealand: http://www.stats.govt.nz/browse_for_stats/population/estimates_and_projections/NationalPopulationEstimates_MRAt30Jun17.aspx
Statistics New Zealand. (2017, July). Trending topics – migration. Retrieved from Statistics New Zealand: http://www.stats.govt.nz/browse_for_stats/population/Migration/international-travel-and-migration-articles/trending-topics-migration.aspx
Westpac New Zealand. (2017, August). Red News. Retrieved from Westpac: https://www.westpac.co.nz/assets/Red-News/Westpac-QEO-Aug-2017.pdf
Penny - Population expert
Based in New Zealand, Penny primarily looks after our Kiwi clients but also lends her expertise to the Australian context. Penny has extensive experience as a Communication Manager in Local Government and has a degree in Business and Communications. She also brings a breadth of generalist management experience in fields as varied as research, civil defence, project and event management, marketing and training. Penny’s knowledge combined with the .id tools help clients work with their communities to empower grass roots decision-making, advocacy and grant applications, and focus on strengthening council-community relationships. Penny has a rural property and enjoys growing and eating food and wine, which she runs, walks, bikes or swims off, when she’s not in the art studio.