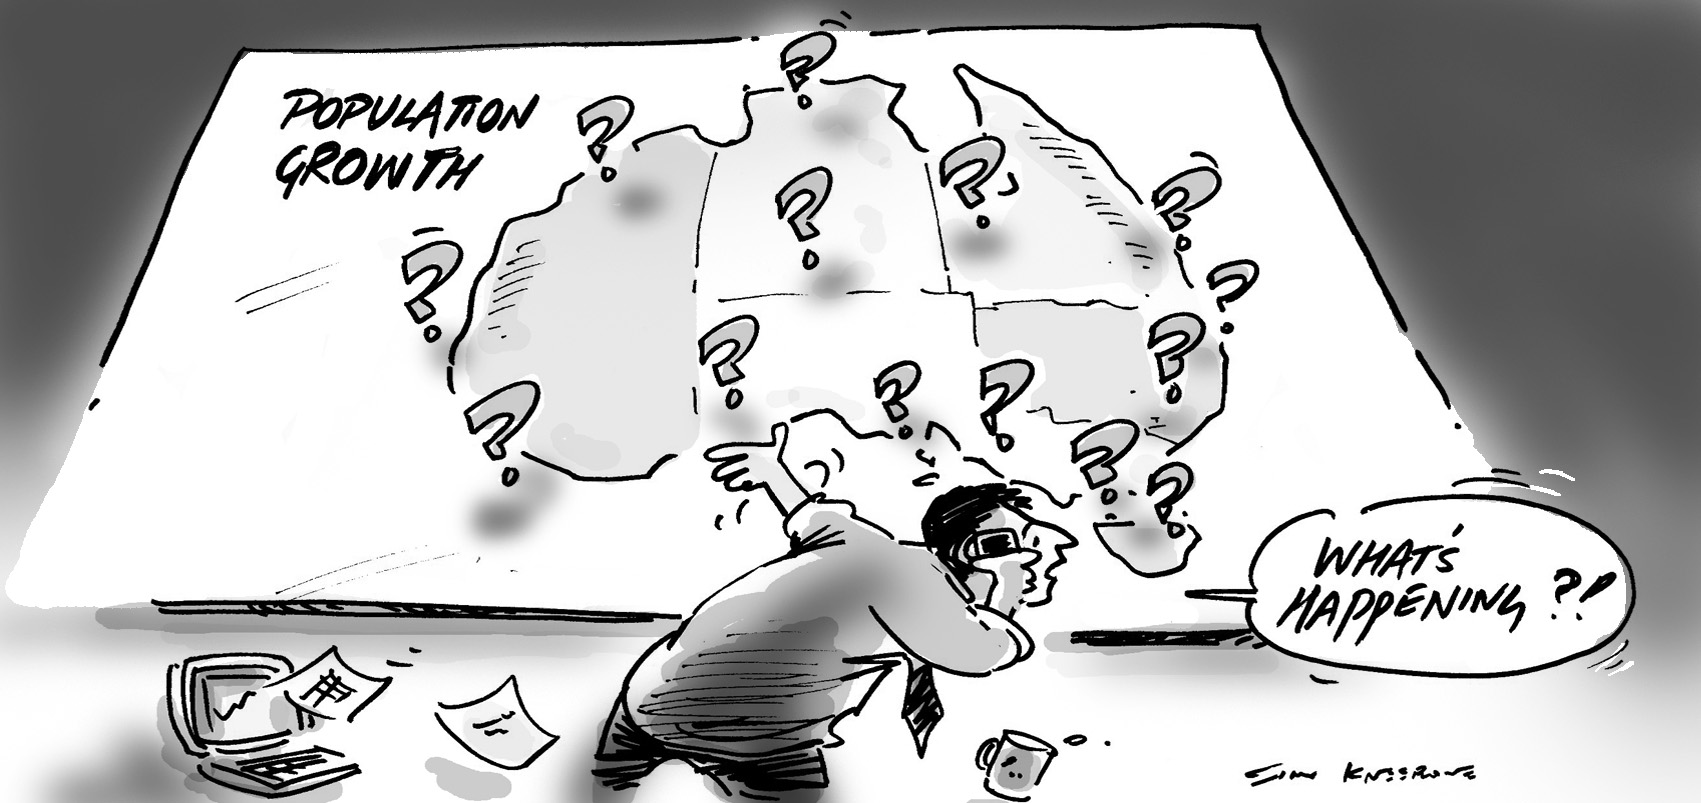
Why did the Estimated Resident Population change?
You may have noticed that as part of the 2016 Census data release, the ABS releases updated Estimated Resident Population (ERP) figures for Australia and the states. When we look at these new state-based ERPs, some interesting revisions have been made, so we thought we’d try to explain what has happened.
When the ABS release Census data every 5 years, they include two different population figures: the Census count and the ERP.
The ERP is made up of the Census counts, along with the number of people who were overseas on Census night (who are not counted in the Census) and estimates of the number of people who didn’t fill in a Census form (net undercount), to give a more accurate estimate of the actual population. In the 5 year period following a Census, the ERPs are modelled each quarter using births, deaths and migration information to provide a more up-to-date population estimate. When new Census data are released, the ABS re-bases the ERP figures to the new Census counts to provide a more accurate base number to start the next 5-year cycle with. So this year, the ERP was released in March (still modelled from the 2011 Census data) and then revised again in June using the new 2016 Census counts.
Comparing the pre-Census ERP (based on 2011 Census) and the post-Census ERP (based on 2016 Census) gives us a chance to see not only how things have changed over the past 5 years but also how accurate the modelling of the ERP has been between Censuses.
Comparing the pre and post-Census ERP
Below you can see a comparison showing the 2011 Census counts, the pre-Census ERP (modelled based on 2011 Census) from March, the new June ERP figures based on 2016 Census data, and the difference between the two estimates.
Overall, we can see that Australia grew by 8.4% over 5 years, adding just under 2 million people.
Victoria was the fastest growing state, growing by 11.6% over 5 years, while Tasmania grew the slowest, adding just 1.2%. Victoria has not grown this fast since the 1880s.
The difference between pre and post-Census ERPs
The really interesting thing is the difference between the pre-Census and the revised post-Census ERPs.
After the previous Census in 2011, the ABS revised the population down by 280,000 people once the Census results were received. This time, following the 2016 Census, they have revised their estimates UP by 83,650 people. That is, there are 83,650 more people in the country than we thought there were before we did the Census.
While most of the state-based adjustments were relatively minor, they varied enormously between the states. Western Australia’s population has been adjusted downwards by more than 2% in the revision, dropping 58,221 people. At the same time, Victoria’s population has “increased” (actually been revised up) by a massive 111,207 people, also around 2% of the state’s population.
Why are the ERPs so different?
These changes indicate that the ABS may have miscalculated the magnitude of the population shift at the end of the mining boom. While WA’s population growth has been declining since 2014, the magnitude of the move back to the eastern states had been underestimated, and this puts it back in perspective. Victoria is now booming, while the West struggles. Not so long ago WA was growing at 3.3% p.a. In the last year it was 0.7%.
The population numbers of other states have also been adjusted, but by much smaller amounts, under 10,000 in each case.
What impact does this have?
One of the key reasons for running the Census is to balance the number of people in each electorate in Federal Parliament, ensuring fair distribution of votes in our democracy. And this is a case where we are likely to see an immediate change from this population distribution. According to Antony Green’s election blog, these numbers mean that South Australia is likely to lose a seat in the House of Representatives, while Victoria and the ACT will gain one each. But we have to wait for the AEC to decide on these matters.
As part of this Census release, the ABS also updated the population counts to December 2016, and the latest updated figure for this time period is 24,385,635.
You can see all these results and the rebased estimates in Australian Demographic Statistics (3101.0) on the ABS website.

.id is a team of population experts who combine online tools and consulting services to help local governments and organisations decide where and when to locate their facilities and services, to meet the needs of changing populations.
Glenn - The Census Expert
Glenn is our resident Census expert. After ten years working at the ABS, Glenn's deep knowledge of the Census has been a crucial input in the development of our community profiles. These tools help everyday people uncover the rich and important stories about our communities that are often hidden deep in the Census data. Glenn is also our most prolific blogger - if you're reading this, you've just finished reading one of his blogs. Take a quick look at the front page of our blog and you'll no doubt find more of Glenn's latest work. As a client manager, Glenn travels the country giving sought-after briefings to councils and communities (these are also great opportunities for Glenn to tend to his rankings in Geolocation games such as Munzee and Geocaching).