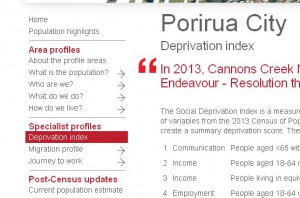
The New Zealand 2013 Social Deprivation Index (NZDep) data was released recently. For those councils with profile.id, the updated NZDep figures can be viewed for each city/district down to a small area geography defined by that council. Look under “Specialist profiles” in the left menu.

Historically, the NZDep has only been around for a couple of decades. First developed in 1994 from 1991 census data, the 2013 iteration is now the fifth time the index has been revised. Other measures such as the Health and Equity index had been employed up until the early 90s, but the need for more fine-grained analysis sourced from smaller geographic areas was the key motivator for the social and government agencies behind the NZDep development. Put simply, the NZDep can better identify pockets of deprivation because it garners information on populations of between 100 and 300 people.
Technical note: A key feature of the NZDep is the small area of analysis, however meshblock populations (the smallest census data area) vary both numerically and spatially. To ensure robust results some meshblocks are aggregated to at least 100 Usual Residents. So in general small areas consist of one or two neighbouring meshblocks (i.e within Stats NZ internal primary sampling units).
As a standardised national index, revised on a regular basis, the NZ Dep is employed across many sectors including national and sub-national education, health and housing organisations, the police and, of course, local government.
What demographic indicators does the NZDep consider?
The NZDep calculation uses a range of variables from the Census representing nine dimensions of socio-economic disadvantage to create a summary deprivation score. The nine variables (proportions in small areas) in decreasing weight in the index are:
Social deprivation index
1 Income People aged 18-59 receiving a means tests benefit
2 Employment People aged 18–59 years who are unemployed
3 Income People living in equivalised households with income below an income threshold
4 Communication People with no access to a telephone
5 Transport People with no access to a car
6 Support People aged less than 60 years living in a single parent family
7 Qualifications People aged 18–59 years without any qualifications
8 Living Space People living in equivalised households below a bedroom occupancy threshold
9 Owned Home People not living in own home
Yet there is always discussion on the helpfulness of aggregate indicators. Even at the meshblock level, by their very basis as an aggregate, they can mask key differences between areas.
Clearly the characteristics of neighbourhood don’t confirm rigidly to boundaries of census areas, meshblocks or census area units. And those boundaries often change so care needs to be taken comparing index scores over time. Also NZDep figures are an abstract concept that only begins to partially describe an area. However in practise an index score can be misunderstood as a concrete assessment of an area.
While the NZDep is great for highlighting differences between areas, the geographical basis for the index can also lead to negative labelling. That means the complexity of the underlying issues sometimes overridden by the in-your-face stigma an area may grow for being in a higher decile (9 or 10s). To that end the researchers behind the NZDep, Claire Salmon and Peter Crampton, clearly direct NZDep users to refer to areas as having “the most deprived NZDep scores”, rather than labelling them “the most deprived areas”.
Another mistake sometimes made is applying the index score to areas or individuals within the small area as an approximate measure. From a neighbourhood-wide perspective non-deprived neighbourhoods can be home to deprived individuals and visa versa, so an individual index like the NZiDep should be used when looking at singular cases.
Misunderstandings can also come about with the NZDep decile scales. These are an intuitive tool to be used across different disciplines and contexts, but their simplicity can mask the underlying complexity of the index. Also, because the scale is in deciles, 10% of areas must always fall in the lowest decile and 10% in the highest, irrespective of their relative positioning. Imagine in the global context how decile ten areas in New Zealand might compare to areas with high deprivation ranking in say the Republic of Congo (the lowest ranked country in the 2012 United Nation Development Programmes’ Human Development Index.
Overall, the value of the NZDep as an indicator to quickly locate small communities that might need assistance is clear. But users also need to be aware of the holes they can fall into if they are not careful what they use it for.
Access NZDep scores for New Zealand council areas at .id’s demographic resource centre.


