Statistics New Zealand releases the first population estimates from adjusted 2013 census data
If you are armpit deep in LTP planning, Statistics New Zealand’s release of revised subnational population estimates as at June 2013 will have been very, very welcome.
The national population estimates using the results from the Census Post-enumeration survey for 2014 are also interesting – albeit still provisional. As at 30 June 2014 The New Zealand population was estimated at 4.51 million, a 1.5% increase on the previous year. The following figure tracks steady growth with our national population increasing from 4,087,500 in 2004, to 4509,000 a decade later.
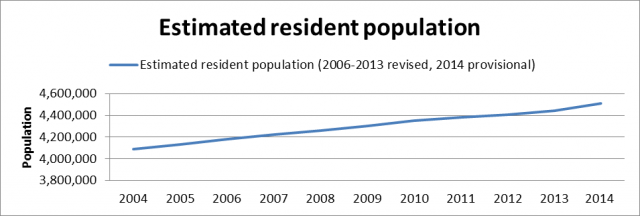
The 1.5% growth rate over the last year is the highest recorded in the last decade and is the result of a natural increase of 29,500 and a surge in net migration of 38,300. Looking back over the last seven years, the revised estimates reveal a more modest average annual population growth of 0.8%.
However, focusing on the contribution of natural increase and migration to population change, the next chart highlights that the volatility of net migration (arrivals less departures) as a key factor in the latest result. Conversely natural increase (births less deaths) has continued on a relatively steady path, with a small but consistent decline over each of the last five years. Natural increase now sits at 2004/2005 levels.
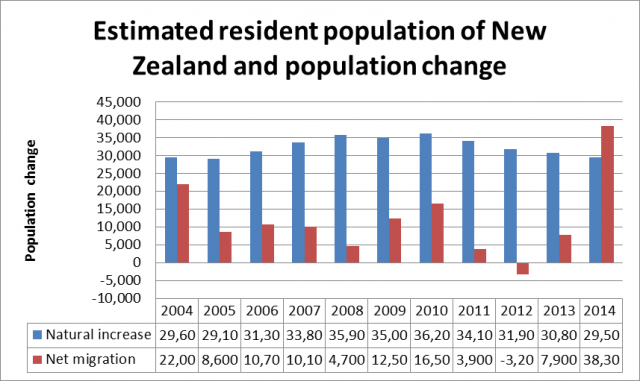
The 2014 result is particularly unusual because net migration rose above natural increase for the first time in the decade, largely a result of a drop-off in outwards migration to Australia (for example in the year ending December 2013 there was a marked drop in our net loss to Australia, down from nearly 40,000 per year to just 19,000 in that year).
[I often get asked what the inwards migration figure is made up of. In short, migrant arrivals include those who intend to stay longer than 12 months, or stay permanently. This figure incorporates New Zealand residents returning after being absent for a year or longer.]
Why are the estimates so important?
Statistics New Zealand release ERP figures each year. They are the official population count and the most accurate approximation of population. The revised ERP figures developed after the Post-enumeration survey take on additional relevance because of the length of time between the 2006 and 2013 censuses and the potential for deviation. For example the new 2013-base estimate at 30 June 2013 was 29,000 lower than the 2006-base estimate at the same date.
How is the ERP derived?
Statistics New Zealand start with the 2013 census usually resident population and make the following adjustments
- Allow for people who have missed the census or who have been counted more than once – this adjustment is made using the results of the Post-enumeration survey
- Adjust for resident who were temporarily overseas on census night
- Adjust for the net migration and natural increase (births less deaths) between census night and 30 June 2013
- Reconciliation with demographic estimates for ages 0-9 years.
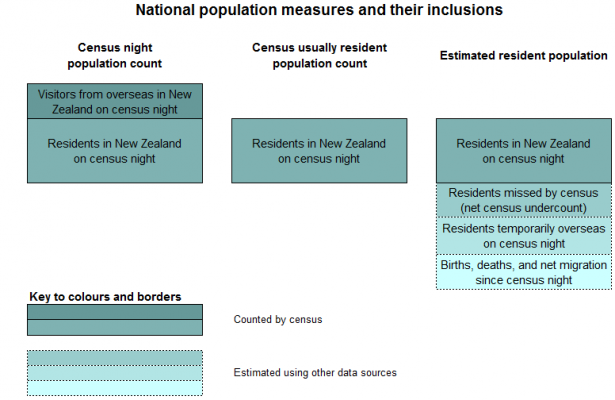
The following figure is sourced from Statistics New Zealand and illustrates the difference between Census night counts, the Usual Resident Population and Estimated Resident Population figure.
To access all our NZ community profiles – now with 2013 census data, visit our demographic resource centre. If you enjoyed this article, subscribe to our blog or newsletter and keep up-to-date with the latest demographic and population trends.
Penny - Population expert
Based in New Zealand, Penny primarily looks after our Kiwi clients but also lends her expertise to the Australian context. Penny has extensive experience as a Communication Manager in Local Government and has a degree in Business and Communications. She also brings a breadth of generalist management experience in fields as varied as research, civil defence, project and event management, marketing and training. Penny’s knowledge combined with the .id tools help clients work with their communities to empower grass roots decision-making, advocacy and grant applications, and focus on strengthening council-community relationships. Penny has a rural property and enjoys growing and eating food and wine, which she runs, walks, bikes or swims off, when she’s not in the art studio.


