What goes into developing a micro-geographic population forecast?
You may know that here at .id we create population forecasts to help our clients understand future demand for services and infrastructure, but have you ever wondered what goes into developing a population forecast?
Developing granular planning information
.id’s Small Area Forecast information (SAFi) provides business and community planners with population information from a macro state-wide level, right down to the detail of a city block. We consider it essential to deliver population and dwelling forecasts at a geographic level that allows planners the ability to drill down into the detail of local areas or build up information into custom catchment areas that directly align with business planning requirements.
Producing population forecast information at such a granular level requires a detailed understanding of all the forces at play. While understanding the drivers of demand is important for forecasting population at a regional level, combining this with an understanding of residential supply is crucial in order to ground-truth assumptions and model our population forecasts.
.id’s population forecasting team (the largest in the country) invest a significant amount of time to identify and track where and when residential development will occur. Understanding the dwelling potential of an area helps us ensure that our population forecasts are as accurate as possible (essentially we are ground truthing there are dwellings available for people to live in). We use a variety of sources including (but not limited to):
- Local government input (we work with over 300 Councils across Australia)
- Aerial photography (Landgate, Nearmap)
- Building approval data
- Cadastral analysis (changes to the number of dwellings on a parcel of land)
- Cordell property database
- Council development application databases (Development Approval trackers)
- Government master plans, structure plans and local development plans
- Land use changes – planning schemes and potential rezonings
- Input from developers and utility providers
Understanding where (and what type of) dwellings are being built helps us understand the people who will occupy them. For example, apartments tend to be occupied by younger singles and couples, while new houses on the fringe are popular with young families hoping to get a foothold in the property market. In older suburbs, the demographic profile may consist of more families with older children and empty nesters and might change as large blocks close to transport nodes are rezoned to allow for higher density housing.
The underlying layer of intelligence
To keep track of all the intricate detail that goes into a population forecast, .id has an underlying database layer we call the Universal Development Layer (UDL). The UDL is a live mapping layer that allows us to interrogate development data in a geographic manner and can be used in a GIS platform (such as MapInfo, ArcGIS or our own .id Placemaker tool).
The UDL includes core information about a development site (name, address, suburb etc.) as well as more detailed information about where the site is at in its development cycle (completed, under construction, approval, mooted), when it is likely to be completed, and how many dwellings will be created.
The UDL in action
Using the Mill Point peninsula area in South Perth, Western Australia as an example, we can see how the UDL tracks essential detail required to create the development assumptions that go into a population forecast. The map and table below show the location and basic information about developments expected to occur in the Mill Point peninsula area of South Perth from 2017 to 2022.
Given recent changes to the planning scheme allowing higher density development in this area, much of the development in this area will be in apartments. The Mill Point peninsula benefits from proximity to the Perth CBD, a prime natural setting along the Swan River, and good road and public transport linkages – which will be improved by the construction of a new train station in South Perth in the future.
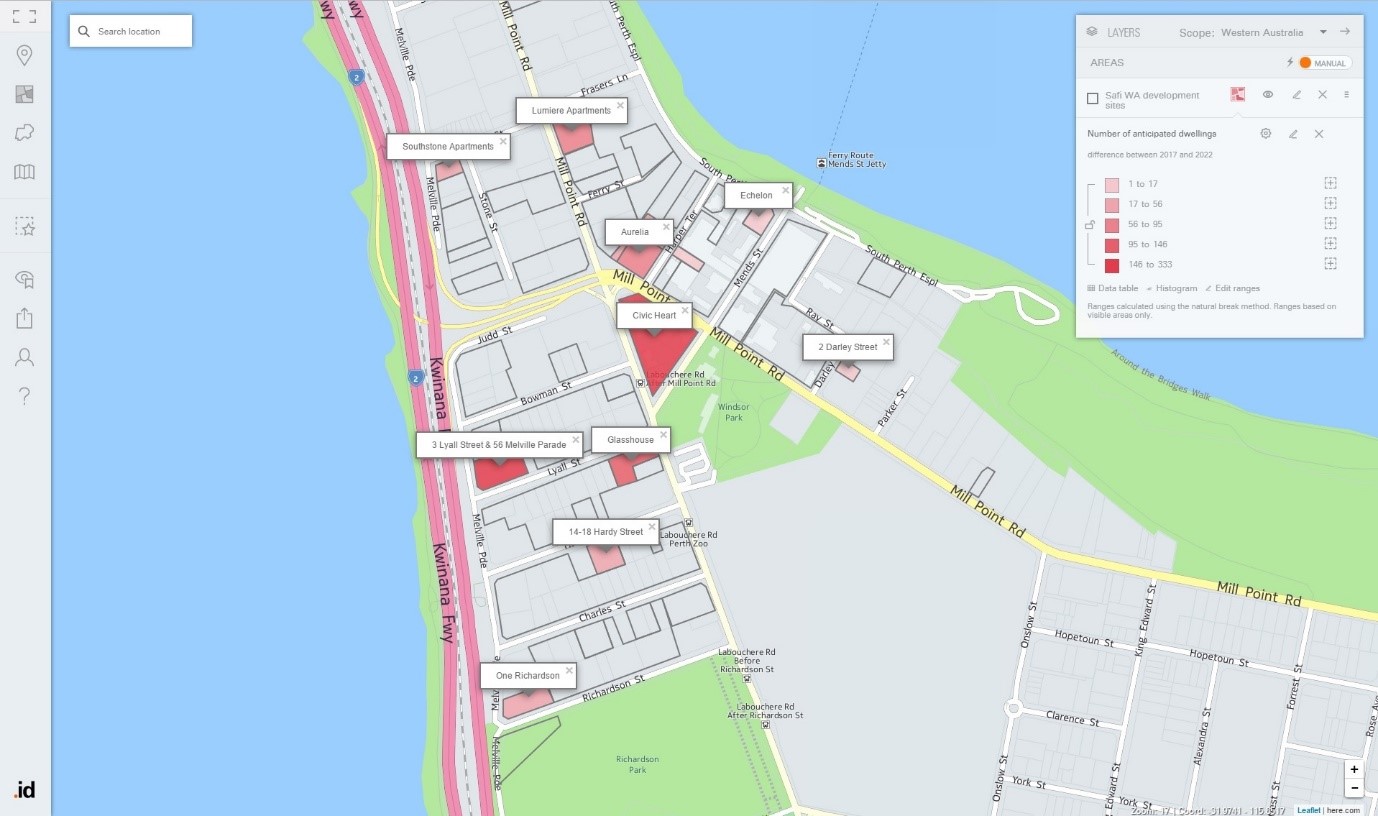
| LGA | Site Name | Address | Capacity | Assumed Dwellings, 2017-2022 | Area (in ha) |
| South Perth (C) | Pinnacle South Perth | 30 Charles St, South Perth | 102 | 100 | 0.259 |
| South Perth (C) | Southbank | 98 Mill Point Rd, South Perth | 14 | 14 | 0.073 |
| South Perth (C) | One Richardson | 3 Richardson St, South Perth | 70 | 53 | 0.219 |
| South Perth (C) | Civic Heart | 97 Mill Point Rd, South Perth | 294 | 287 | 0.785 |
| South Perth (C) | Lumiere Apartments | 72 Mill Point Rd, South Perth | 91 | 84 | 0.194 |
| South Perth (C) | Aurelia | 96 Mill Point Rd, South Perth | 118 | 95 | 0.216 |
| South Perth (C) | 5 Harper Terrace | 5 Harper Terrace, South Perth | 56 | 56 | 0.17 |
| South Perth (C) | Glass House – Westbridge | 31 Labouchere Rd, South Perth | 148 | 146 | 0.195 |
| South Perth (C) | 14-18 Hardy St | 14 Hardy St, South Perth | 39 | 36 | 0.17 |
| South Perth (C) | Southstone Apartments | 1 Stone Street, South Perth | 19 | 18 | 0.084 |
| South Perth (C) | Echelon | 77 South Perth Esplanade, South Perth | 12 | 11 | 0.11 |
| South Perth (C) | 2 Darley St | 2 Darley St, South Perth | 12 | 11 | 0.057 |
| South Perth (C) | 3 Lyall Street & 56 Melville Parade | 1 Lyall St, South Perth | 350 | 332 | 0.284 |
Source: id – the population experts
Read more about WA’s population change in our new eBook, Western Australia: Is it all doom and gloom after the boom?
Based on our assessment of development potential in the Mill Point peninsula, we would expect an additional 1,200 dwellings in major sites to be built in this area over the next five-year period.
Change is the only constant
Of course, the timing of developments can change over time – some developments slow down or drop out while others advance more quickly based on supply and demand. For example, given there is potential for an oversupply of housing in Perth in the near term, we might expect apartment development to slow down. The higher risks to developers, limited availability of financing for larger scale projects and reduced demand for housing due to lower gains in migration will, in turn, relate to poorer employment prospects in Perth and WA in the near-term.
As you can imagine, there is a lot of change to stay up to date with, which is why we revisit our development assumptions at the beginning of each forecast cycle, ensuring the residential growth picture is as accurate and timely as possible.
Development potential
When we develop population forecasts, we also identify the future potential for development in an area based on proposed rezonings/upzonings, council structure plans/local development plans, and potential industrial turnover. For example, Osborne Park, a suburb 6 km north of the Perth CBD in the City of Stirling, is undergoing a transition from a mostly industrial precinct to a mixed use/residential/commercial hub. As in other inner city old industrial precincts (like Fisherman’s Bend in Melbourne or Green Square in Sydney), market forces are encouraging the development of large lot industrial parcels towards higher and more intensive uses. The Council has been actively involved in developing a strategic direction for this kind of development in the area, which includes a significant residential component.
We also investigate the development of new infrastructure, such as roads and train lines/stations, to assess their impact on the local housing market. For example, the Forrestfield-Airport Link, which will link the Perth Airport and Forrestfield to the CBD by rail, will provide opportunities for higher density development around the new stations. The proposed Belmont station is expected to become a hub for a significant commercial and residential catchment.
If your organisation could benefit from the granular level of development information captured in the UDL, contact us for more information.
.id is a team of demographers, population forecasters, spatial planners, urban economists, IT and data experts who use a unique combination of information, applications and consulting to help governments and organisations understand people and places for evidence-based planning.
Access our population forecasts for Local Government Areas here.
SCOTT HONG
Scott’s background is in urban planning, economic development and GIS. He worked for an economic planning consultancy in New York City and is passionate about making our cities more liveable, equitable and beautiful. His role at .id is on the SAFi team where he researches and applies the future assumptions to our population forecast models. Scott enjoys exploring the nooks and crannies of his new hometown and planning his next trip to an exotic locale.