BLOG
Latest population figures: Top 50 largest cities and towns in Australia in 2016
Latest population figures: Top 50 largest cities and towns in Australia in 2016
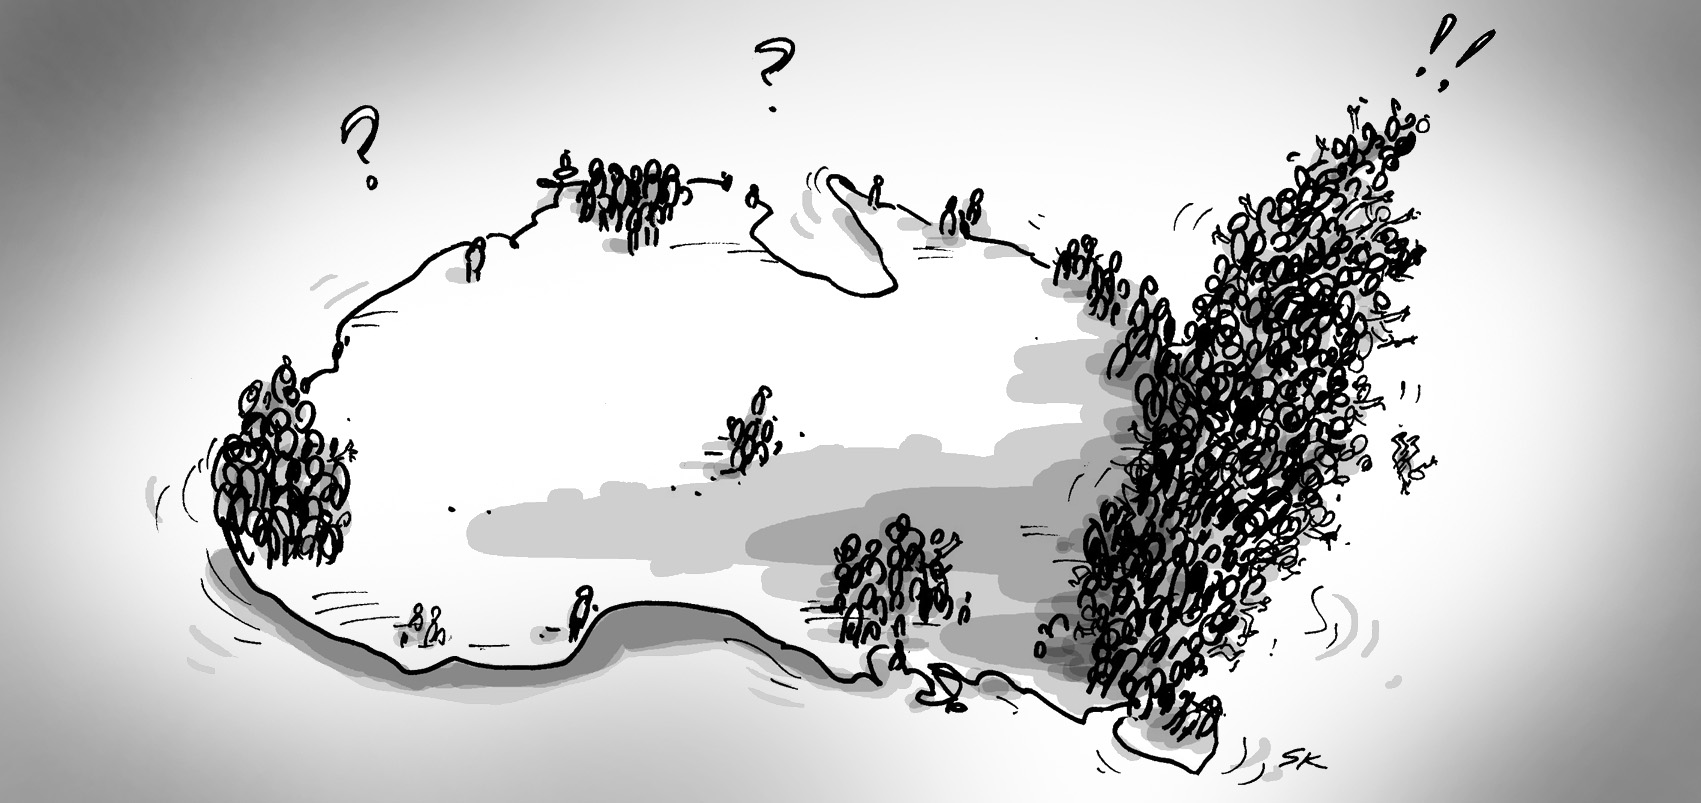
This is the latest release of the Top 50 cities and towns in Australia, which we do every year, following the ABS release of their Regional Population Growth publication. As we’ve previously seen, Australia, already an urban nation, is adding more and more people to our capital cities, which accounted for 83% of population growth in the past year, and 77% of the past 5 years’ growth.
This view of the top 50 centres is a little different. There are centres in here (eg. Melton, Central Coast) which are considered part of the Greater Capital Cities, but which also stand alone as discrete centres in their own right. However most suburbs which are contiguously urban within our larger metropolitan areas are included in the population for that larger centre (Sydney, Melbourne, Brisbane etc.).
For reference, Australia overall has grown 1.4% in the past year, and 7.9% in 5 years.
It’s also worth mentioning that we’re a long way from the last Census at this point, and so the figures coming out of the ABS on population are less certain – they are all subject to review after the 2016 Census results are released.
| Significant urban area | Population June 2015 | 5 year growth | 5 year % growth | 1 year growth | 1 year % growth | |
|---|---|---|---|---|---|---|
| 1 | Sydney | 4,526,479 | 343,008 | 8.2% | 77,565 | 1.7% |
| 2 | Melbourne | 4,353,514 | 399,575 | 10.1% | 86,796 | 2.0% |
| 3 | Brisbane | 2,209,453 | 190,379 | 9.4% | 33,702 | 1.5% |
| 4 | Perth | 1,958,912 | 235,694 | 13.7% | 26,163 | 1.4% |
| 5 | Adelaide | 1,288,681 | 63,013 | 5.1% | 11,970 | 0.9% |
| 6 | Gold Coast – Tweed Heads | 624,918 | 53,518 | 9.4% | 10,798 | 1.8% |
| 7 | Newcastle – Maitland | 434,454 | 23,938 | 5.8% | 3,964 | 0.9% |
| 8 | Canberra – Queanbeyan | 424,666 | 26,236 | 6.6% | 2,825 | 0.7% |
| 9 | Central Coast | 325,082 | 12,492 | 4.0% | 2,202 | 0.7% |
| 10 | Sunshine Coast | 302,122 | 24,918 | 9.0% | 4,864 | 1.6% |
| 11 | Wollongong | 292,388 | 13,058 | 4.7% | 3,333 | 1.2% |
| 12 | Hobart | 209,254 | 5,808 | 2.9% | 1,594 | 0.8% |
| 13 | Geelong | 187,417 | 12,206 | 7.0% | 3,236 | 1.8% |
| 14 | Townsville | 180,333 | 16,263 | 9.9% | 1,755 | 1.0% |
| 15 | Cairns | 147,993 | 10,842 | 7.9% | 1,359 | 0.9% |
| 16 | Darwin | 123,396 | 10,409 | 9.2% | 1,974 | 1.6% |
| 17 | Toowoomba | 114,622 | 5,926 | 5.5% | 1,044 | 0.9% |
| 18 | Ballarat | 99,841 | 8,206 | 9.0% | 1,332 | 1.4% |
| 19 | Bendigo | 92,888 | 6,910 | 8.0% | 1,122 | 1.2% |
| 20 | Albury – Wodonga | 88,949 | 5,704 | 6.9% | 1,153 | 1.3% |
| 21 | Launceston | 86,633 | 1,049 | 1.2% | 263 | 0.3% |
| 22 | Mackay | 85,455 | 7,425 | 9.5% | 448 | 0.5% |
| 23 | Rockhampton | 80,665 | 5,670 | 7.6% | 353 | 0.4% |
| 24 | Bunbury | 75,628 | 9,593 | 14.5% | 1,563 | 2.1% |
| 25 | Bundaberg | 70,588 | 1,879 | 2.7% | 76 | 0.1% |
| 26 | Coffs Harbour | 68,572 | 2,569 | 3.9% | 561 | 0.8% |
| 27 | Melton | 59,500 | 13,040 | 28.1% | 2,623 | 4.6% |
| 28 | Wagga Wagga | 55,820 | 1,929 | 3.6% | 489 | 0.9% |
| 29 | Hervey Bay | 52,288 | 3,043 | 6.2% | 466 | 0.9% |
| 30 | Mildura – Wentworth | 50,011 | 1,792 | 3.7% | 194 | 0.4% |
| 31 | Shepparton – Mooroopna | 49,371 | 2,303 | 4.9% | 309 | 0.6% |
| 32 | Gladstone – Tannum Sands | 49,248 | 7,226 | 17.2% | 1,232 | 2.6% |
| 33 | Port Macquarie | 45,341 | 2,629 | 6.2% | 493 | 1.1% |
| 34 | Tamworth | 42,255 | 2,626 | 6.6% | 471 | 1.1% |
| 35 | Traralgon – Morwell | 40,816 | 765 | 1.9% | 19 | 0.0% |
| 36 | Orange | 40,075 | 3,087 | 8.3% | 334 | 0.8% |
| 37 | Geraldton | 39,825 | 3,490 | 9.6% | 246 | 0.6% |
| 38 | Bowral – Mittagong | 37,897 | 1,901 | 5.3% | 425 | 1.1% |
| 39 | Dubbo | 36,941 | 1,885 | 5.4% | 342 | 0.9% |
| 40 | Busselton | 36,285 | 5,674 | 18.5% | 997 | 2.8% |
| 41 | Bathurst | 36,013 | 2,685 | 8.1% | 644 | 1.8% |
| 42 | Nowra – Bomaderry | 35,920 | 1,842 | 5.4% | 559 | 1.6% |
| 43 | Warrnambool | 33,979 | 1,288 | 3.9% | 133 | 0.4% |
| 44 | Albany | 33,970 | 2,491 | 7.9% | 356 | 1.1% |
| 45 | Warragul – Drouin | 33,386 | 4,155 | 14.2% | 700 | 2.1% |
| 46 | Kalgoorlie – Boulder | 32,797 | 1,307 | 4.2% | -139 | -0.4% |
| 47 | Devonport | 30,497 | 263 | 0.9% | 42 | 0.1% |
| 48 | Lismore | 29,413 | 205 | 0.7% | 43 | 0.1% |
| 49 | Mount Gambier | 28,929 | 737 | 2.6% | 114 | 0.4% |
| 50 | Alice Springs | 27,972 | – 425 | -1.5% | -291 | -1.0% |
These top 50 centres combined have a population of 19,411,452, or 82% of Australia’s population. So less than 1 in 5 people lives OUTSIDE one of the top 50 centres. And 47% live in just the top two – Sydney and Melbourne.
Based on these numbers, Melbourne would overtake Sydney in only about 8 years – but this version of Sydney excludes the Central Coast, nominally a part of Greater Sydney.
Looking at the growth figures, Melton stands out as the highest growth centre, but it’s really part of Greater Melbourne, being only 40km from the CBD.
Other high growth centres are Melbourne itself (2.0%), Gladstone (2.6%), Busselton (2.8%) and Warragul (Vic, 2.1%).
In the past 5 years, almost all of these centres have increased. Only number 50, Alice Springs, fell in population. Over the past year it is joined by Kalgoorlie, but 48 of the top 50 centres grew.
All our community profile and economy.id sites have been updated with the latest population figures for your area. But don’t forget, these are all subject to review after the next Census results are released.
.id is a team of population experts, who use a unique combination of online tools and consulting to help organisations decide where and when to locate their facilities and services, to meet the needs of changing populations. Access our free demographic resources here.
To find out which age groups are growing fastest in Australia, read our ebook: Three growth markets in Australia
Glenn - The Census Expert
Glenn is our resident Census expert. After ten years working at the ABS, Glenn's deep knowledge of the Census has been a crucial input in the development of our community profiles. These tools help everyday people uncover the rich and important stories about our communities that are often hidden deep in the Census data. Glenn is also our most prolific blogger - if you're reading this, you've just finished reading one of his blogs. Take a quick look at the front page of our blog and you'll no doubt find more of Glenn's latest work. As a client manager, Glenn travels the country giving sought-after briefings to councils and communities (these are also great opportunities for Glenn to tend to his rankings in Geolocation games such as Munzee and Geocaching).


