How has Western Australia’s population aged over time?
One of the more effective ways to demonstrate changes in the composition of the population is to look at the age structure over time. Observations that span a generation or more show where the population has come from, and where it is today. We all know about the ageing of the population, but what other changes can be observed over time? Let’s have a look at how Western Australia’s age structure has changed since 1975.
Western Australia has an age structure that is slightly younger than the Australian average. In 2015 the median age in Western Australia was 36.1 years compared to 37.4 years for Australia. This reflects higher levels of overseas migration (particularly during the recent mining boom), a higher fertility rate, and a slightly higher proportion of Indigenous people. However, like most of Australia, the population is ageing slowly over time.
Western Australia – age structure by year
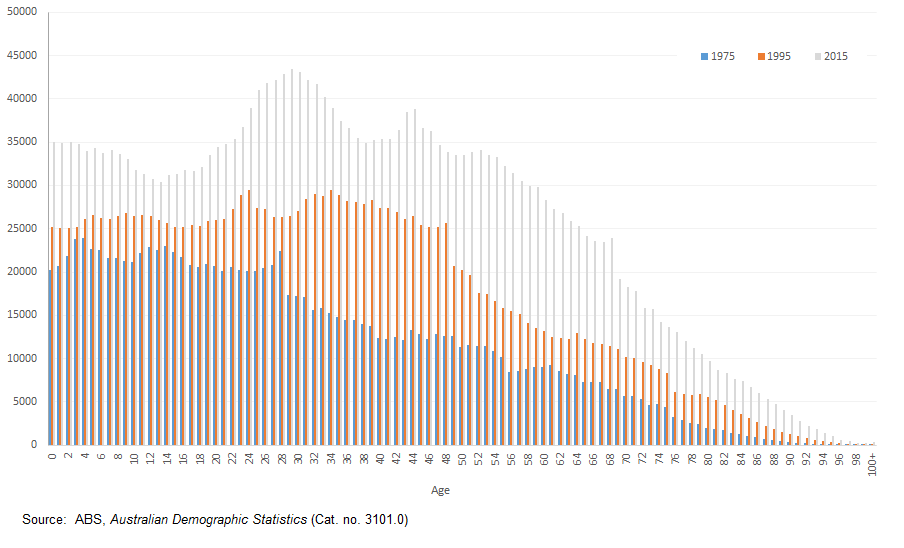
The chart below shows the age structure of the Western Australian population by single year of age at 1975, 1995 and 2015.
1975
In 1975, the population of Western Australia was just 1.16 million. The State had a youthful age profile, with just over half the population aged under 30 years. This is visible in the blue bars in the chart, with the bulk of the population is in the younger age groups on the left – almost 30% were aged 0-14 years. This youthful population was primarily a result of the post-war baby boom i.e. people born from the late 1940s to the early 1960s. Around 8% of the population was aged over 65 years and just 0.5% were aged 85 years and over.
1995
Fast forward 20 years to 1995 when the population reached 1.74 million, but the composition of the population changed markedly. The baby boomers have matured and are now aged from around 30-50 years old. By and large, they now have their own families. However, their fertility behaviour has differed to that of their parents, as rates were relatively low in the late 1970s and throughout the 1980s. This, coupled with lower levels of overseas migration at this time, resulted in a lower number of children compared with the previous generation. Improvements to health and life expectancy have resulted in an increase in older persons, such that persons aged 65 years and over comprised around 10% of the population. At the same time however, their numbers doubled. The increase for the 85 years and over was more marked – the numbers tripled but they still comprised just 1.0% of the population. So in 1995 while the population had aged compared to 1975, the bulk of the population was still aged under 50 years of age.
2015
By 2015 the age composition reflects contemporary trends of increased fertility and overseas migration. The population is now 2.59 million and there are three distinct “bumps” in the age structure, the older one reflecting the now ageing baby boomer cohort (now at least 50 years of age), a second one of young adults (20-34 years) bolstered by a recent wave of overseas migration, and a third of children (mainly under 5 years of age). The increase in the number of children reflects the double whammy of increased fertility and overseas migration, the latter of which increases the “supply” of women in the family forming age groups due to the age structure of overseas migrants.
The population in 2015 has continued to age – 13% of the population are now aged over 65 years and their numbers have doubled again since 1995. But again it’s the increase in the 85 years and over population that really tells the story of ageing and the demand on health services and accommodation for the aged. The numbers more than doubled since 1995, to reach almost 42,000 or 1.6% of the population. The increases in very elderly persons is a clear indicator of life expectancy improvements and improved health outcomes whereby a greater number of people are surviving to advanced ages.
Ageing over time
The age chart demonstrates how the generations age over time and their movement through the age spectrum. You can see a clear indicator of when the post-war baby boom began in the 1975 data, with a high number of 28 year olds compared to 29 year olds – 22,336 and 17,387 respectively. People aged 28 in 1975 were born post-war in 1947. By 1995 these now 48 year olds are still evident in the chart, as they are again in 2015 where they are aged 68.
Actual numbers will vary due to migration and mortality but the onset of the baby boom generation in Western Australia appears to have been very sudden based on this data. Not only can you see the starting point, but the bulk of this generation can be clearly seen to move through the age spectrum in 1995 and in 2015. This generation will still be obvious when we present an update to this chart in 2035 (when the oldest baby boomers will be 88 years old).
While the post-2007 born population is not as obvious in the age structure as the post-war baby boom, the numbers of children are greater in size than the teenage cohort and they are having an impact on the provision of education services in the short to medium term as they progress through the school system. In many parts of metropolitan Perth, schools are dealing with increased enrolments not only in growth areas but in established parts of the city. Compare this situation to that of 1995 when the numbers of children moving through the school system did not differ greatly from year to year – now the challenges for service provision are very different.
While this chart shows the macro-level trends for Western Australia, the age composition of the population will differ based on location. However, understanding how and why populations change and evolve is essential to planning age-based services over time. How does the age structure differ in your area? What challenges are you facing? Drop us a line and let us know!
.id is a team of population experts including demographic and spatial analysts, urban economists, industry sector experts, IT and data management specialists. Access our free demographic resources to see how your area is changing over time.
Simone - Myth Buster
Simone has a rich background in human geography, demography and urban planning – a background that was useful in her previous roles in the Commonwealth and State Governments, and now as part of the forecast team at .id. From the Queensland coast to the southern suburbs of Perth, Simone produces population and dwelling forecasts that help local governments make informed decisions about future service and planning needs. She is a regular contributor to .id’s blog and has spoken at several conferences on how our cities and regions are changing. She is a big advocate of evidence-based planning and how Census and other data can inform this. Outside of work Simone is a keen traveller and photographer – interests that tie in well with her professional life and help her to understand “place”.