So, who voted Trump?
While many around the world are still coming to terms with new American president-elect Donald Trump, some are asking: Who voted for Trump?
Being in the USA and closely following the elections, I decided to take a look at the US voting population and the demographics of Trump and Clinton voters.
*Please note: this is not a political commentary.
Right up to the day of the election, the polls were consistently favouring democrat candidate Hillary Clinton – you can see this here. So what happened?
It has been an eye-opening experience being in New York City at this time of the year. After all, both Trump and Clinton were in town. A largely blue (Democrat/Hillary Clinton) state, New York had been preparing for a historic celebration of Clinton’s victory. Watching the news in my hotel room that morning on November 8, news anchors weren’t questioning if Clinton or Trump would win the presidency. Rather, how big a margin would Clinton and the democrats win this election. By early evening, hundreds and maybe even thousands of people, including several media, were gathered at Times Square awaiting the results of the election.
How many voted?
Unlike Australia, voting is non-compulsory in the United States. As of Thursday morning in America, approximately 131 million votes were counted – this represents approximately 57 percent of eligible voters. In comparison, 58.6 percent of eligible voters voted in the 2012 election while this figure was up to a high of 62.2 percent in 2008. While the 2016 election showed a decline in the number of voters from the previous two elections, it is not particularly surprising as historically, voter turnout during a presidential election year often ranged between 50 to 60 percent – You can see all figures here.
Who voted Trump?
During the election, exit polls which are surveys done after voters have cast their ballots are conducted to understand how segments of people voted. Below, I’ve highlighted a few interesting results. You can see more here.
24,537 respondents.
From this table, we can see that a typical Trump voter would be male, Caucasian (white), above the age of 45, with lower education – of course, this is not true to everyone but it a good indicator as to the segments of voters who resonated with Trump’s policies and campaign messages.
One of the figures many people still can’t get their heads around is: 53% of Caucasian women voted for Trump despite his recent comments and scandals. I guess the answer to this question can only be known by the voters themselves…
Clinton won the popular vote but lost the election. Why?
This happened to Al Gore in 2000 as well where he won the popular vote with approximately 500,000 more votes than former president George W. Bush. With the final votes still being counted, Clinton is looking to win the popular vote with approximately 47.7 percent of the overall ballots cast over Trump’s 47.4 percent. However, the United States work on an electoral college system where each state is allocated a number of electoral votes that supposedly corresponds to the size of the state’s population – this is to ensure fairness where the votes of the smaller states are not disregarded. Is this system really fair, effective or democratic? That’s a conversation for another day…
As of now, the final projected electoral votes stand at 306 for Trump and 232 for Clinton.
As I hung around Times Square till the wee hours of November 9, the mood in New York City turned from excitement and anticipation to confusion and panic. The night ended with nothing short of disappointment. Even before Trump was announced as the official president-elect, some people were visibly upset, sobbing with their Hillary badges still pinned to their chests.
What will a Trump presidency mean for them? And for us down south in Oz? We will only begin to find out in the interesting journey ahead…

The glass ceiling that never got shattered – Javits Convention Center, November 8/9, 2016.
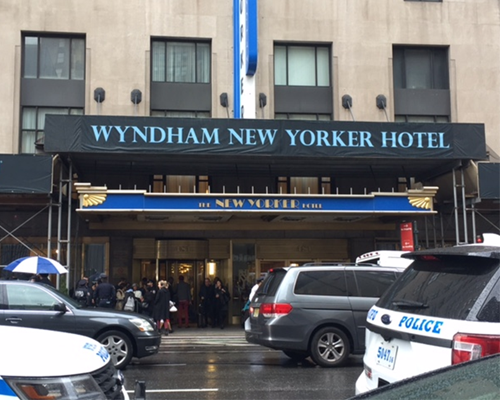
The media was rather secretive about where Clinton was giving her concession speech on the morning of November 9 but I happened to walk pass the New Yorker that morning and voila!
.id are a team of population experts who view demographic and economic data through a spatial lens to help governments and organisations plan for the future. You can access .id’s range of free demographic resources and tools here.
Rebecca
Rebecca’s background is in marketing and communications and she has previously worked in media companies in Singapore. She is constantly fascinated by technology, so much so that she has enrolled herself in a PhD course to understand how media technologies impact people in different spaces. She's working with us part time to help us negotiate the world of online communications. When you read our blog or our newsletter, it’s Rebecca’s hard work behind the scenes that bring these to you.