The 50 largest Australian cities and towns by population in 2014
**This blog has been updated: Read the 2018 version of Top 50 largest cities and towns in Australia by population here.
A couple of years ago, I did a blog post about Australia’s top 33 cities by population. This was a very popular blog which was a ranking of the biggest cities in Australia and so I’ve updated it here (and expanded it to the top 50 largest Australian cities) with the latest population figures from the ABS as at 2013. For more up to date population and population forecasts for NSW, read our blog on the Top 20 fastest growing suburbs in NSW. Watch this space for other states.

So, without further ado, on to the list!
The 50 largest Australian cities and towns by population
This is based on the top 50 Significant Urban Areas in Australia at June 2013 Estimated Resident Population, and 5 year growth 2008-2013.
Please note that the geographic classification of urban centres has changed since we wrote our previous blog Australia’s top 33 cities by population. Consequently the tables are not directly comparable (see more detail about geography changes below).
Find detailed information for over 500 Australian communities by visiting the .id Demographic Resource Centre.
Some interesting points about this list:
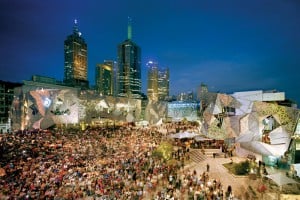
- Sydney remains Australia’s largest urban centre, but it’s now only 5% bigger than Melbourne. The exclusion of Central Coast has an impact, but Melbourne has also had some outlying centres like Melton excluded. Melbourne is growing faster and should overtake Sydney within about 25 years on current trends.
- The fastest growing centres in this list are Ellenbrook (WA) and Melton (Vic) – which is a little misleading as these centres are really part of Greater Perth and Greater Melbourne respectively, but are separated in the new ABS list.
- NSW has 18 centres (including cross-border ones) in the top 50 list, by far the most of any state. South Australia manages only one, Adelaide. Mount Gambier just misses out, in 51st place.
- Despite a population only a quarter the size of South Australia, Tasmania manages 3 entries in the list, Hobart, Launceston and Devonport, due to a more dispersed population. Queensland also “punches above its weight” with 10 entries, more than Victoria with a much larger population. This is for the same reason, a dispersed population.
- All of the top 50 centres increased in population over 5 years. The lowest growth was in Lismore, just 1.9%. In the top 100 centres, only 2 showed decline over that period, Broken Hill and Moe-Newborough.
Further reading
You might like to download our e-book Predicting the Growth Suburbs of the Future to look at where we see population growth occurring in the future.
And our National Demographic Indicators website has the population and other demographic measures for every Local Government Area in Australia.
Notes on geography
Populations are more malleable than people think, and really depend on where you draw the boundaries. For example Central Coast is no longer included as part of Sydney but has its own identity in this list. This means that Sydney’s population appears substantially lower than in the previous list, which used the Greater area and had no listing for Central Coast.
The ABS have come up with new boundaries, called “Significant Urban Areas”, so this article has used these, and ranks the centres by these new boundaries.
According to the ABS, Significant Urban Areas “represent concentrations of urban development with a population of 10,000 or more using whole Statistical Areas Level 2 (SA2s). They do not necessarily represent a single Urban Centre, as they can represent a cluster of related Urban Centres with a core urban population over 10,000. They can also include related peri-urban and satellite development and the area into which the urban development is likely to expand.”
What this means is that they represent cities and towns as most people understand them, but in some cases, areas may be subsumed within a larger Significant Urban Area (eg. a contiguous suburb of a major city would generally be included as part of that city). Large satellite centres which are part of the Greater Capital City area, but geographically separated, are now separately identified in many cases (hence Central Coast being separated from Sydney.
So the important thing to remember is that this represents a particular way of drawing boundaries to rank areas but it may not be the only one. If your area isn’t listed, it’s likely included as part of another major centre, due to geographic proximity.
Access the Australian Community Profile to find Census results for each Capital City, State, and Australia on topics including population, age, country of birth, languages spoken, occupations, industries, employment, disability, income, qualifications, transport and much more…
Glenn - The Census Expert
Glenn is our resident Census expert. After ten years working at the ABS, Glenn's deep knowledge of the Census has been a crucial input in the development of our community profiles. These tools help everyday people uncover the rich and important stories about our communities that are often hidden deep in the Census data. Glenn is also our most prolific blogger - if you're reading this, you've just finished reading one of his blogs. Take a quick look at the front page of our blog and you'll no doubt find more of Glenn's latest work. As a client manager, Glenn travels the country giving sought-after briefings to councils and communities (these are also great opportunities for Glenn to tend to his rankings in Geolocation games such as Munzee and Geocaching).