What does the 2018 Census tell us about New Zealand?
Any Census is a mighty undertaking that provides invaluable data for community planning and development. The 2018 New Zealand Census was no exception. In this blog, Penny pulls out some highlights from our new eBook: What does the 2018 Census tell us about New Zealand?
Want to read the whole thing? Download the eBook here.
There is no doubt that the COVID-19 crisis will have a huge influence on the demographic characteristics of regions, local councils and smaller areas. The timing of New Zealand’s 2018 Census means it creates an up-to-date pre-COVID baseline; a profoundly rich source of data for strategists, planners and policy roles in Government agencies, Local Government, community organisations and businesses.
New Zealand’s latest Census garnered low response rates, and so there were changes to the way data was sourced.Our new eBook reviews the 2018 Census problems, the resulting data quality and the raft of other changes in 2018, including geographical classification and topic additions and adjustments. Also included is a wide-ranging look at the results and a peek at what might come next.
A quick overview
.png)
Meeting the challenge of low reponse rates
Early in the Census collation process, Stats NZ would have known (with a sinking heart) that response rates were well down on prior years. They delayed releasing data and embarked on several significant reviews. In the end, they used several alternate sources and methods to fill what gaps they could.
- Administrative data Information gathered from official sources (eg health or education datasets).
- 2013 Census data Used where an assumption could be made that little has changed for a person since the last Census.
- Imputation A method of filling in missing data from some respondents based on the response of similar respondents.
Data quality outcomes
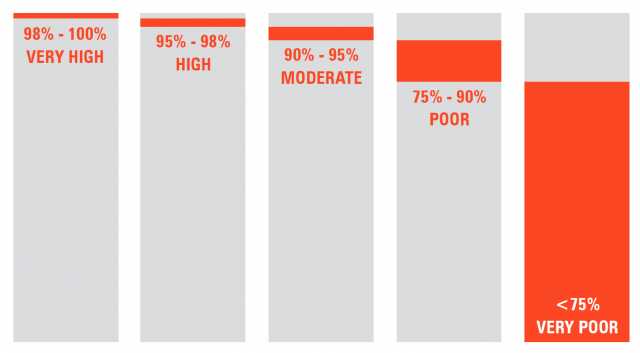
With so many new methods for data sourcing in play, Stats NZ employed a rigorous approach to classifying each topic covered. Quality ratings are comprised of three metrics:
- Data sources and coverage
- Consistency and coherence
- Data quality
The lowest rated metric determines the overall quality rating. As shown below, data quality needs to rate very highly to be classified as “moderate” or above.
Better data, harder comparisons
For some datasets, the new methodologies (in particular administrative data) resulted in a significantly higher quality than previous Censuses – using alternate sources to augment Census responses effectively removed the ‘Not stated’ category.
This gives a much more complete picture for this Census. However, comparisons with previous Censuses needs to take this into account. Increases in certain topics are due more to better data collection rather than signifcant demographic changes.
Stats NZ has been thorough in explaining where this time comparison challenge applies, and our NZ Community Profiles include flags on data where this applies.
Keep reading
To get the full picture, download “What does the 2018 Census tell us about New Zealand?”.
Penny - Population expert
Based in New Zealand, Penny primarily looks after our Kiwi clients but also lends her expertise to the Australian context. Penny has extensive experience as a Communication Manager in Local Government and has a degree in Business and Communications. She also brings a breadth of generalist management experience in fields as varied as research, civil defence, project and event management, marketing and training. Penny’s knowledge combined with the .id tools help clients work with their communities to empower grass roots decision-making, advocacy and grant applications, and focus on strengthening council-community relationships. Penny has a rural property and enjoys growing and eating food and wine, which she runs, walks, bikes or swims off, when she’s not in the art studio.