Geelong region – a growth area’s affordable housing journey
Geelong and surrounding LGAs are experiencing unprecendeted growth, from Melbourne and around Victoria. In this blog, Glenn looks at the impact this growth is having on the region’s housing story. Where is this growth happening? How is housing affordability and availability changing? What sectors of the community are in housing stress? As always, our goal at .id is to use data to tell a story that enables policymakers to make informed decisions.
The G21 – Geelong Region Alliance alongside the City of Greater Geelong are the latest regions to add .id’s Housing Monitor (housing.id) tool. The Housing Monitor allows Local Government to monitor the supply, demand and affordability of local housing over time, creating an evidence base for informing housing-related decisions.
There are two sites, one with the summary of the G21 Region (consisting of 5 LGAs: Greater Geelong, Golden Plains, Surf Coast, Colac-Otway and Queenscliffe) and the other a with all the detail for the City of Greater Geelong and its suburbs. As with all our sites, they are public access so can be used by people outside of Local Government as well.
What’s happening with population growth?
Greater Geelong is Victoria’s second-largest urban area (after Melbourne) and the third-largest Local Government Area (after Casey and Wyndham). In 2019, the population of Greater Geelong was 258,934 people, with a growth rate of 2.7% (well above the state’s 2.1%), and adding between 6,000 and 7,000 people per annum for the past 5 years. The G21 region population is 340,616 all up; though it contains some more remote rural areas, the overall region’s growth rate was only a slightly slower, coming in at 2.6%.
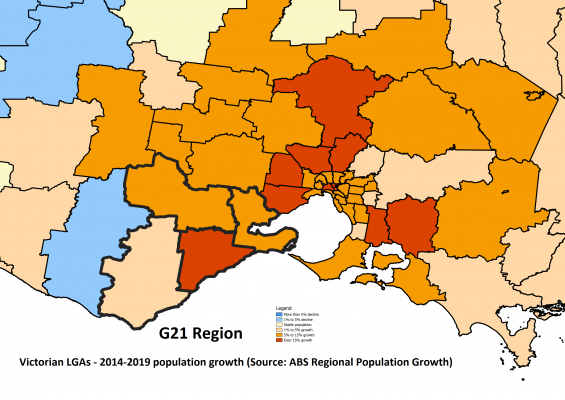
This means that the G21 region is growing by over 8,000 new residents every year, putting it well above the state average and among the fastest growing regions in the nation. This hasn’t always been the case. Geelong’s manufacturing base declined over many decades. There was almost no growth through the 1990s and just 20 years ago the population was barely growing, adding just 1,000 or so people per annum.
What’s driving population growth?
Geelong has reinvented itself, with huge growth in service industries – particularly health care and tertiary education – as well as burgeoning construction driven by new housing on the fringes of Geelong, Torquay, Bannockburn and the Bellarine Peninsula. Major government offices and companies are locating in Geelong and the City’s economy grew to $13.6 billion in 2019, about 3% p.a. economic growth.
There is substantial in-migration to the region from metropolitan Melbourne driven by housing opportunities in the large land releases, which are relatively more affordable than Melbourne in many cases. There is also movement from Melbourne to the growth areas of Geelong, such as the new suburb of Armstrong Creek on the south side and Lara on the north side. The City also attracts new residents from regional Victoria, with many relocating for employment and education.
Some residents do need to commute out for work. About 15,000 residents commute to the Greater Melbourne area. This is around 14% of employed residents; more than 80% of residents work within the region.
Other parts of the region are also seeing strong growth, with people living in the Surf Coast in particular, seeking the sea-change lifestyle in booming Torquay, Anglesea etc and commuting to Geelong (and to a lesser extent Melbourne) for work. The COVID-19 pandemic and “work from home revolution” may see this trend accelerate in future, if less people need to be tied to an office location.
What does this mean for housing in the G21 region?
The G21 region is a formal alliance of government, business and community working to improve the lives of people in the whole Geelong region. The G21 alliance supports wide area project delivery and advocacy for the region. G21 has been particularly concerned about housing affordability across the Geelong region, in the light of those trends mentioned above. Housing prices are rising. While the growth areas are attracting people from metropolitan Melbourne, compared to which it is relatively affordable, housing is becoming less affordable to those who live in the area.
With incomes lower in Regional Victoria than Melbourne, it is harder for long-term residents to buy and rent dwellings in the area. The Housing Monitor tool is helping the G21 region to quantify this, and advocate for the provision of more diverse and affordable housing in the region. Let’s look at some of the characteristics of the region.
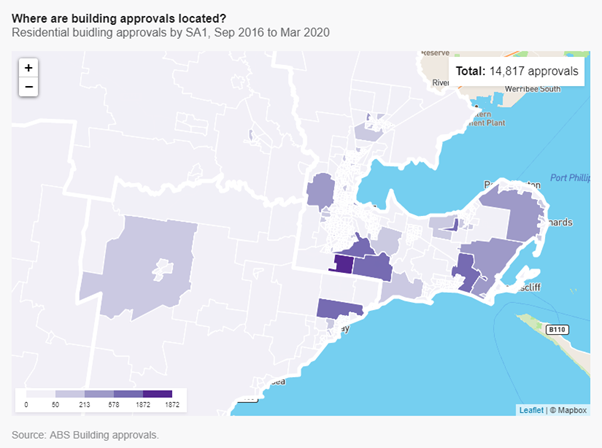
Where is new housing being built?
The following map shows the last 4 years of development activity in the G21 region. There have been nearly 15,000 new dwellings approved in 4 years, and you can clearly see the focus in the Armstrong Creek, Charlemont and Mount Duneed (i.e. the new growth areas between Geelong and Torquay). There is also strong growth in coastal areas on the Bellarine Peninsula, north of Geelong around Lara and west to Fyansford.
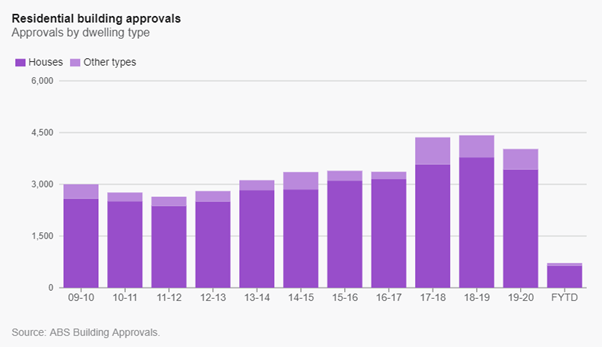
Comparing building approvals over previous years clearly shows the strong surge in approvals over the last few years.
Housing consumption: what sort of housing is being built?
Overwhelmingly this is growth in the family housing sector, with 4-bedroom separate houses being the mainstay of population growth and making up almost 80% of the region’s housing growth over 5 years to the last Census.
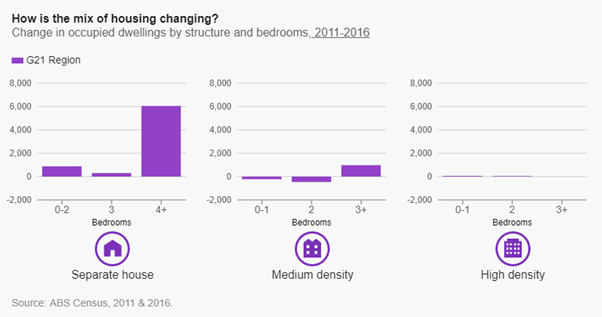
Looking at housing consumption, it’s perhaps not surprising that couple families with children largely live in 3–4+ bedroom separate houses, and all the increase for this family type is in the 4+ bedrooms category.
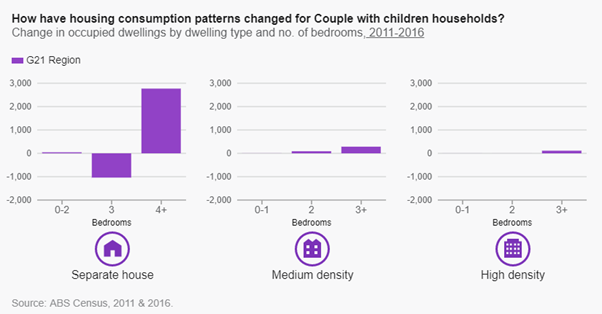
It should be noted, however, that single-parent families are much more likely (53.3%) to live in 3-bedroom separate houses. This may be an issue with affordability. Single-parent families are typically lower income and find it more difficult to access affordable housing – and comparatively fewer smaller dwellings are being built. About 10% of all households in the G21 region are single parents. Social housing makes up only 3.1% of all housing in the G21 region and has declined over time. The new investment in social housing recently announced by the Victorian Government may address this in future.
What’s happening with home and rental prices?
So the G21 housing story is one of high-in migration, from Melbourne and other regional areas, seeking more affordable housing predominantly in new growth areas on the fringes of Geelong, Torquay and the Bellarine Peninsula. But exactly how affordable is this housing?
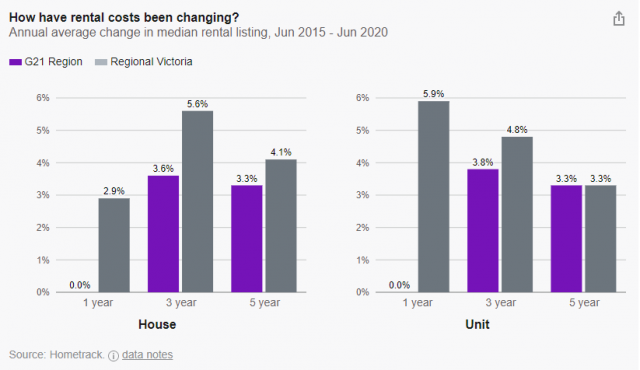
These charts show house/unit prices and change over the past 5 years. Even at the entry level, house prices are much higher than the Regional Victoria averages and have been growing strongly for the past few years. The Geelong Region housing market is becoming much more similar to Greater Melbourne, with much of the migration coming from there.
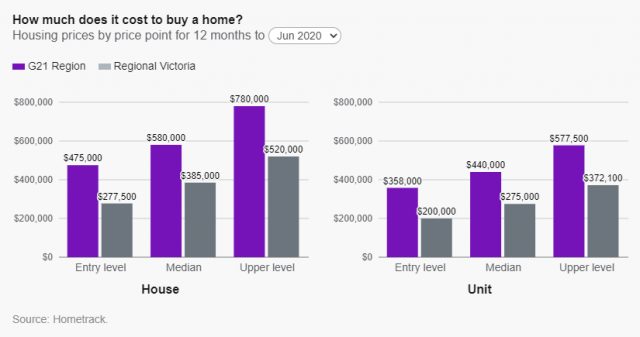
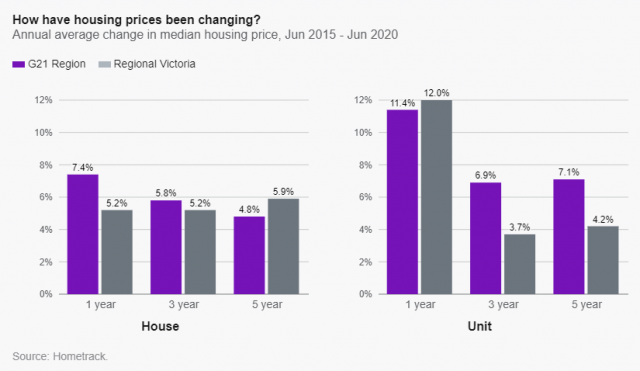
These charts show house/unit prices and change over the past 5 years. Even at the entry level, house prices are much higher than the Regional Victoria averages and have been growing strongly for the past few years. The Geelong Region housing market is becoming much more similar to Greater Melbourne, with much of the migration coming from there.
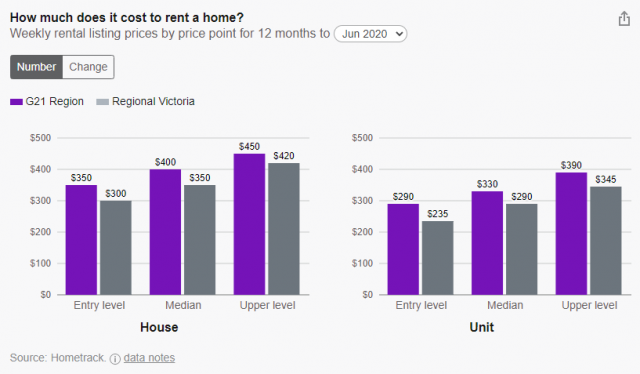
The cost of renting shows similar increases. The absolute value of rents is lower than metropolitan Melbourne but higher than Regional Victoria. The median rental price for a house is $400/week (June 2020) and for a unit it’s $330/week.
Mismatched incomes and housing costs lead to housing stress
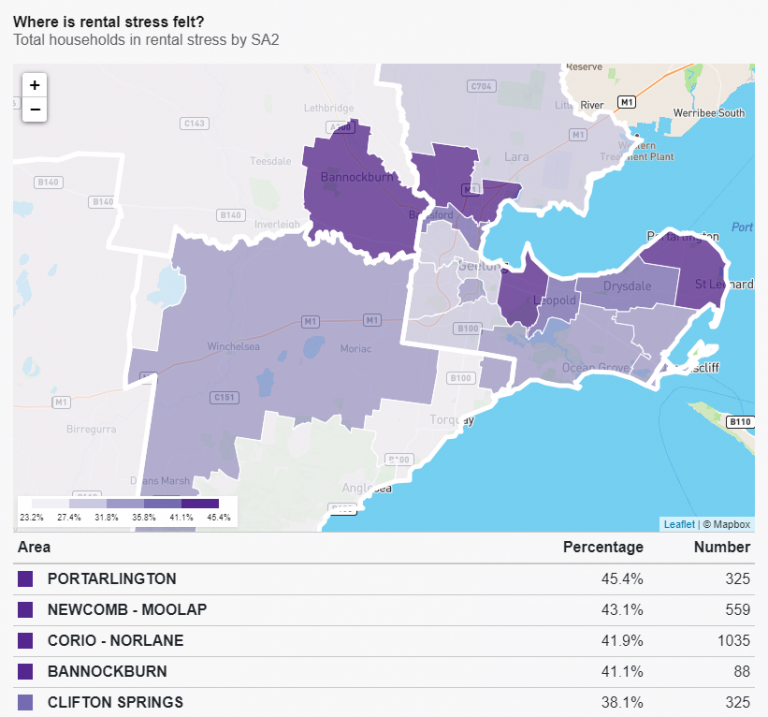
The problem is that incomes in the G21 region, while a bit higher than Regional Victoria, aren’t at the levels of Metropolitan Melbourne. And while incomes are increasing, housing costs are increasing at a faster rate. This leads to housing stress. At the 2016 Census, 12.0% of the households (over 14,000) were in housing stress, in that they were considered low-to-middle income and paying more than 30% of gross income on housing costs. The bulk of this (over two-thirds) is in the rental stress category: 39.2% of all renting households across the region were in rental stress. Most of these were in the very low and low income categories (defined as <50% and 50-80% of median income in regional Victoria, respectively).
The highest rates of rental stress are found in these areas.
These charts show the issue. (In the Housing Monitor tool this data – the equivalent for house prices – are updated every 6 months with new housing data, so you can see whether housing is becoming more or less affordable over time.)
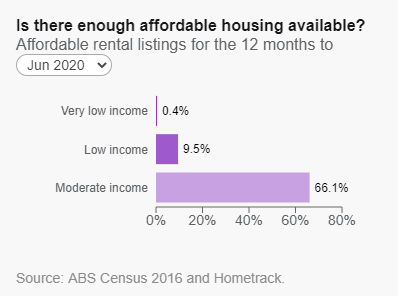
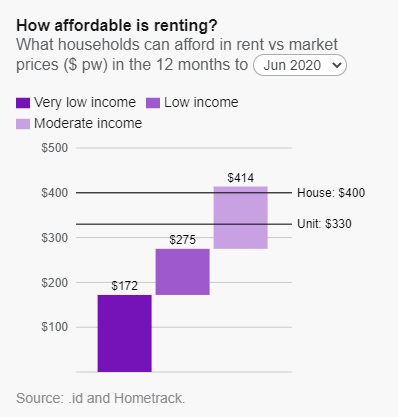
It is only at the “Moderate” income level that much of the rental stock in the Geelong region becomes affordable (at 30% of income). This is based on Regional Victoria’s average incomes, and defined by the State Government as 80% to 120% of the median income; it differs between household types but is approximately incomes between $48,000 and $72,000 p.a. (inflation adjusted since the last Census). Below this level, less than 10% of rentals are affordable, and virtually none at the “very low income” range. The very low range usually needs to be served by the public housing sector, while affordable housing partnerships often target that low to moderate range, sometimes including “key workers”.
The situation for mortgages is even more severe. For this, the analysis needs to use a few assumptions, because not all home-buyers make the same payments. We assume these are first home buyers. (Given enough equity from elsewhere, many low-income people can afford housing but downsizing pensioners aren’t usually the subject of this analysis.) We assume an interest rate about 2% higher than prevailing rates, a 20% deposit and 30-year home loan term.
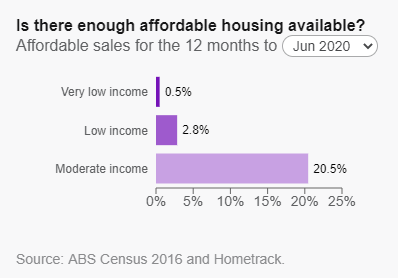
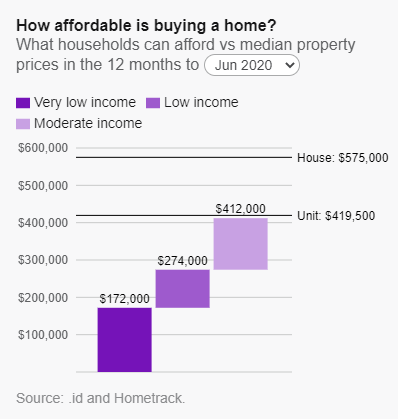
This shows that, for the 12 months ended June 2020, only a little over 1 in 5 (20.5%) dwellings in the G21 region would be affordable to a first-home buyer on a local moderate income level. So why is housing stress so much worse among renters when affordability and availability looks worse for home buyers? The answer is alluded to above: many home buyers are not first home buyers and have smaller mortgages due to having paid off part of a previous mortgage or upgraded with equity from elsewhere. Also to buy a home, to get a mortgage, you need to have a significant income to qualify, so home buyers are more skewed towards the middle and upper incomes in most parts of Australia, and those above 120% of the median income level aren’t considered to be in mortgage stress. That said, this shows a relatively bleak picture for those looking to enter the housing market from within the region.
Tracking this over time shows a small increase in affordability in the last 6 months for moderate income households, but a decrease for the very low category. This dataset is updated twice yearly with the most -up-to-date information on sales and rentals from our partners, HomeTrack.
What types of households are in need of affordable housing?
Pulling all this together gives an estimate of the affordable housing need. Based on low-income households in housing stress and a factor for homelessness, there are 5,898 households in need of affordable housing in the G21 region (4.9% of all households at the 2016 Census).
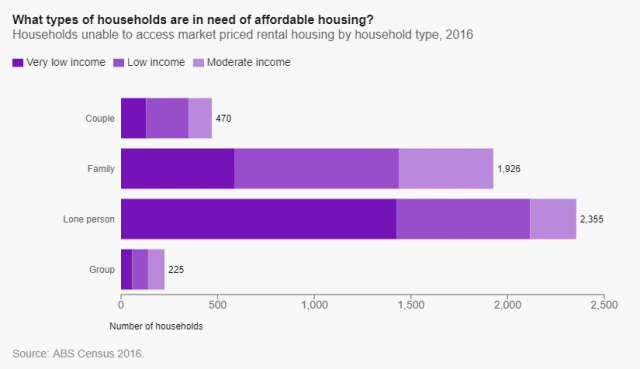
The breakdown of types of households in need of affordable housing shows that lone-person households have the greatest need, followed by families. Linking this back to the region’s housing consumption patterns demonstrates what types of housing are likely to be required to address this need.
Putting this data into action
This evidence base can give policymakers the wherewithal to negotiate with developers and housing providers to include new social housing construction, NRAS housing, rent to own schemes and other affordable housing schemes in new developments. It can help organisations such as G21 successfully advocate for their region.
Don’t forget, while we have a Census every 5 years (next in 2021), we do get the housing updates every 6 months so you can keep a handle on how much the change in prices and rents are affecting this. And of course after the 2021 Census we will get a whole lot of new information, including housing stress in the wake of COVID-19. You can also get current indications of job losses etc. using our Community Profile’s JobSeeker page as well.
Could a Housing Monitor be the solution to your local area’s housing questions? Learn more here.
Glenn Capuano - Census Expert
Glenn is our resident Census expert. After ten years working at the ABS, Glenn's deep knowledge of the Census has been a crucial input in the development of our community profiles. These tools help everyday people uncover the rich and important stories about our communities that are often hidden deep in the Census data. Glenn is also our most prolific blogger - if you're reading this, you've just finished reading one of his blogs. Take a quick look at the front page of our blog and you'll no doubt find more of Glenn's latest work. As a client manager, Glenn travels the country giving sought-after briefings to councils and communities (these are also great opportunities for Glenn to tend to his rankings in Geolocation games such as Munzee and Geocaching).


