Australia's population growth steady at 1.5% p.a.
New population growth data from the ABS reveal that while the national story of population growth remains steady at 1.5%, there are some trends worth noting within our states and territories.
In the year ended June 2019, Australia added 381,619 people, almost identical to the 380,800 people the year before. As a percentage, this is therefore marginally down, but fairly steady at 1.53% population growth.
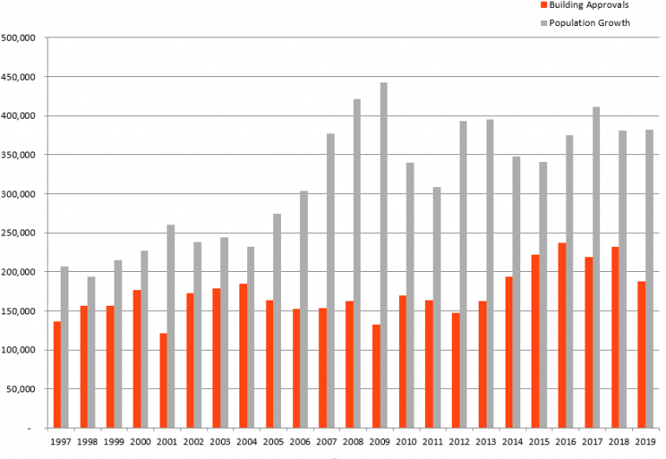
The number of people added to the population has been remarkably consistent for the past 4 years and has been quite high now for 13 years straight, as the chart below shows. This is despite a substantial drop in new building approvals for the year ended June 2019, down by about 40,000 units on the previous year. In fact, there has long been a disconnect between population growth and building – they seem to move in quite different cycles.
The highlights
- NSW is back to losing large numbers of people interstate – mainly to Queensland, which has increasing interstate migration again after a few quiet years.
- Queensland’s growth is getting stronger again, up to 1.7%.
- WA is returning to population growth, albeit slowly. The Sandgropers are stemming the tide of interstate migrants back to the Eastern States which is about half what it was 2 years ago. Add a tick back up in overseas migration, and population growth is back over 1%.
- The Northern Territory’s population loss is accelerating, from 0.1% last year, to 0.5% decline in 2019, losing almost 1,200 people. This is entirely due to interstate migration loss.
- Tasmania continues to grow at a rate not seen for decades, adding almost 6,000, and with a faster growth rate than SA and WA.
- The lion’s share of overseas migrants still come into NSW and Victoria, with slightly more into NSW – but Victoria adds more people due to having positive interstate migration, while NSW is negative.
Australian annual population growth – 1997-2019
Australia’s population at June 2019 stood at 25,364,307.
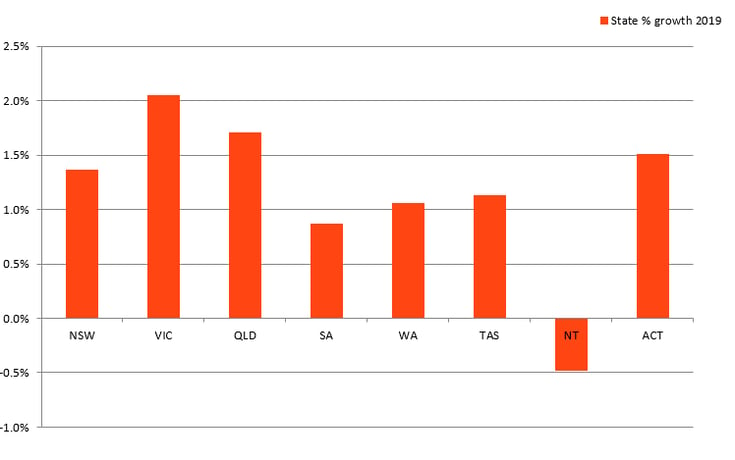
The states/territories are showing large differences in the growth rates for the year. Victoria remains the fastest-growing state, at 2.05%. Historically this is unusual, but Victoria has held this spot now for the past 6 years straight and shows no sign of letting go!
Here are the current populations of each state/territory, with growth and components of change in the past year.
(If you need a refresher on these ‘drivers of population change’, read our previous blogs about natural increase, overseas migration and interstate migration).
No sign of overseas migration slowing down
One remarkable thing at the national level – Overseas migration. For all the talk of cutting migration rates, the number of net migrants in Australia was almost identical to the previous year. In 2018/19, 238,335 more people came to live in Australia than departed. In 2017/18 it was 238,224. So only 100 or so different between the years, and still very high in historic terms.
When will these figures be in the local area profiles?
Just before Christmas the ABS always release these June quarter populations for the nation, states and territories. This is the most important of these quarterly releases as the June 30th figures are the time period for which local data are available too. So we can compare the same time periods, we need to wait for the small area (LGA and lower) data to be released in March, and we can then put the state and smaller area data on the sites at the same time. Therefore, these numbers won’t be reflected on our community and economic profiles just yet. If you’d like to be notified when these new data are made available, subscribe to our updates here and you’ll be emailed whenever we add new data and features to our public tools.
Glenn - The Census Expert
Glenn is our resident Census expert. After ten years working at the ABS, Glenn's deep knowledge of the Census has been a crucial input in the development of our community profiles. These tools help everyday people uncover the rich and important stories about our communities that are often hidden deep in the Census data. Glenn is also our most prolific blogger - if you're reading this, you've just finished reading one of his blogs. Take a quick look at the front page of our blog and you'll no doubt find more of Glenn's latest work. As a client manager, Glenn travels the country giving sought-after briefings to councils and communities (these are also great opportunities for Glenn to tend to his rankings in Geolocation games such as Munzee and Geocaching).