Taking a closer look at South Australia’s Indigenous age profile
Background
One of. id’s blog readers recently contacted .id requesting further information regarding the age profile of younger persons across Australia and South Australia and the State’s Indigenous communities. This is an important subject given five of the seven health and education related outcomes in the Closing the Gap Prime Ministers Report (2018) relate to improving outcomes for Indigenous children.
Having recently joined .id from Adelaide I’m familiar with trends in South Australia’s Indigenous and Non-Indigenous population, having undertaken studies examining migration trends and regional growth/development in small areas across South Australia’s regions.
One of the most useful tools a demographer has for understanding an area is an age profile. Given the Indigenous context, examining age structures between Indigenous and Non-Indigenous populations helps to highlight potential barriers, as well as opportunities to better target government policy within specific areas and communities.
South Australia’s population aging faster than the rest of Australia
Looking first at South Australia’s total population by service groups, the populations largest cohorts are middle aged persons i.e. “parents and homebuilders” (35-49 years) and “older workers and pre-retirees” (50-59 years) followed by the “younger workforce” (25-34 years) (see Figure 1).
Relative to national averages South Australia’s population is older containing larger shares of “older workers” (50-59 years), “retirees” (60-69 years) and “elderly” (70+ years). On the other hand, shares of persons aged younger than 50 years – most notably the “young workforce” (25-34 years) are below national averages, favouring large capital cities for work/lifestyle (i.e. Sydney and Melbourne). South Australia’s faster aging population is a long-term trend driven by higher net outflows of younger skilled workers (people in their 20s) relative to other states due to economic factors.
Figure 1
Population shares by service group, Australia and South Australia, all persons, percent, Census 2016
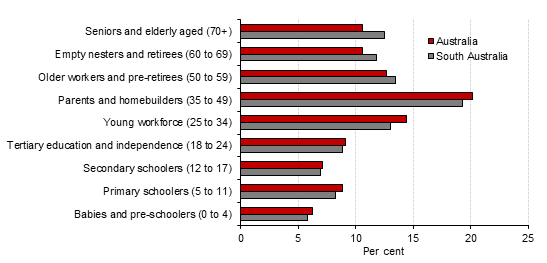
Source: ABS, Census of Population and Housing, 2016.
Australia’s Indigenous population by State and Territory
Looking at the national Indigenous population, the number of Indigenous persons in Australia was 648,947 comprising 2.8 percent of all residents in 2016 (see Table 1) or a small fraction of the total population.
At the state level, approximately 60 per cent of Indigenous Australians lived in two states, New South Wales (216,171 persons | 33.3 per cent) and Queensland (186,484 persons | 28.7 per cent). South Australia’s Indigenous population of 34,190 persons accounted for 5.3 per cent of the national Indigenous population – a relatively small share of the Australian total.
Table 1
Population by state/territory, total persons and Indigenous, number and share, Census 2016
| Number of persons | Share of persons | |||
| State/Territory | Total persons | Indigenous persons | Share of Australia’s Indigenous persons | Share of state/country |
| New South Wales | 7,480,242 | 216,171 | 33.3 | 2.9 |
| Victoria | 5,926,625 | 47,788 | 7.4 | 0.8 |
| Queensland | 4,703,196 | 186,484 | 28.7 | 4.0 |
| South Australia | 1,676,648 | 34,190 | 5.3 | 2.0 |
| Western Australia | 2,474,414 | 75,981 | 11.7 | 3.1 |
| Tasmania | 509,963 | 23,578 | 3.6 | 4.6 |
| Northern Territory | 228,844 | 58,247 | 9.0 | 25.5 |
| Australian Capital Territory | 397,405 | 6,508 | 1.0 | 1.6 |
| Australia | 23,397,337 | 648,947 | 100.0 | 2.8 |
Source: ABS, Census of Population and Housing, 2016.
Note: States and territories may not sum to total.
Indigenous South Australians have a younger age profile
A distinguishing feature of the Indigenous population on a state/territory basis is their younger age profile (see Figure 2). Comparing South Australia’s Indigenous age profile with the State’s total, shows 40 per cent of Indigenous persons are aged 0-17 years i.e. are “babies and pre-schoolers” and/or “primary and secondary schoolers”, nearly double the 21 per cent share for the total population. The opposite relationship occurs at the older end of the Indigenous age profile, i.e. shares of Indigenous persons aged 50+ i.e. “older workers”, “retirees” and “elderly” is less than half the share compared with the total population, 17 per cent versus 38 per cent for the total population. Such differences being driven by higher Indigenous total fertility rates (TFR’s) and higher mortality rates compared with the Non-Indigenous population. Consequently, the Indigenous age profile is skewed towards younger age cohorts.
Figure 2
South Australian population shares by service group, total persons and Indigenous, percent, Census 2016
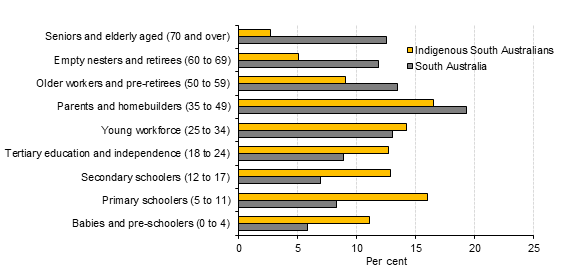
Source: ABS, Census of Population and Housing, 2016.
Over half of South Australia’s Indigenous population lives in Adelaide
The 2016 Census shows a wider geographical distribution in the Indigenous population compared to the Non-Indigenous. In South Australia (a highly urbanised state) 78 per cent of the Non-Indigenous population lived in Greater Adelaide compared with 54 per cent of the Indigenous population (see Table 2). Although the majority of Indigenous persons live in Greater Adelaide, the State’s Indigenous population has a larger regional distribution i.e. a larger share lives in regional centres and/or rural/remote areas relative to Non-Indigenous persons.
Table 2
Greater capital city and rest of state population shares by state/territory, Indigenous and Non-Indigenous, per cent, Census 2016
| Greater capital city | Rest of State | |||
| State/Territory(a) | Non-Indigenous | Indigenous | Non-Indigenous | Indigenous |
| New South Wales | 65.8 | 32.4 | 34.0 | 67.2 |
| Victoria | 76.2 | 50.4 | 23.7 | 49.1 |
| Queensland | 49.7 | 29.0 | 50.1 | 70.5 |
| South Australia | 78.1 | 53.8 | 21.7 | 45.4 |
| Western Australia | 80.5 | 41.1 | 19.3 | 58.1 |
| Tasmania | 44.3 | 36.2 | 55.6 | 63.6 |
| Northern Territory | 74.7 | 20.5 | 24.3 | 78.3 |
| Australian Capital Territory | 0.1 | 99.5 | 0.1 | 0.5 |
| Australia | 68.0 | 34.7 | 31.9 | 64.8 |
Source: ABS Cat No. 2071.0, Census of Population and Housing: Reflecting Australia, Stories from the Census, 2016, Aboriginal and Torres Strait Islander Population.
Note: (a) = Excludes Indigenous persons in Other Territories i.e., Norfolk Island, Jervis Bay Territory, the Territory of Christmas Island and the Territory of Cocos (Keeling) Island.
Looking at the State’s Indigenous population according to urban area, approximately half of Indigenous persons lived in the Adelaide urban area. In terms of the distribution of Indigenous persons a decomposition of the population by urban centre size, indicates 15 per cent of Indigenous South Australians live in small urban areas with 10,000 – 19,999 persons as at 2016 (see Table 3). This compares with 6 per cent of the Non-Indigenous population.
Table 3
South Australia’s Indigenous and Non-Indigenous population by urban centre, per cent, Census 2016
| Number of persons | Share of total | |||
| Urban centre size (persons)(a) | Non-Indigenous | Indigenous | Non-Indigenous | Indigenous |
| Major Urban(b) | ||||
| Greater than 1,000,000 | 1,094,703 | 17,055 | 70.3 | 49.9 |
| Other Urban | ||||
| 20,000 to 49,999 | 67,982 | 2,024 | 4.4 | 5.9 |
| 10,000 to 19,999 | 93,444 | 5,108 | 6.0 | 14.9 |
| 5,000 to 9,999 | 22,302 | 420 | 1.4 | 1.2 |
| 1,000 to 4,999 | 99,489 | 2,986 | 6.4 | 8.7 |
| Rural | ||||
| 500 or more | 30,104 | 674 | 1.9 | 2.0 |
| 200 to 499 | 17,269 | 2,086 | 1.1 | 6.1 |
| Other areas | ||||
| Remainder of State/Territory | 129,414 | 3,566 | 8.3 | 10.4 |
| No usual address | 2,281 | 255 | 0.1 | 0.7 |
| South Australia | 1,557,007 | 34,184 | 100.0 | 100.0 |
Source: ABS Table Builder, Census 2016.
Note: (a) = Excludes Indigenous status not stated and Migratory, Offshore and Shipping.
(b) = boundaries differ to Greater Capital City boundaries.
For younger Indigenous persons aged 0-19 years (children and teenagers) living in urban/rural centres, population distributions were similar to the total population. 51 per cent of younger Indigenous persons lived in the Adelaide major urban area in either “other urban”, “rural” and “other areas” i.e. provincial cities, towns, rural and remote areas (see Table 4).
Table 4
Younger persons in South Australia 0-19 years, Indigenous and Non-Indigenous, number and share, Census 2016
| Number of young persons | Share of young persons | |||
| 0-19 years | 0-19 years | |||
| Urban centre size (persons)(a) | Non-Indigenous | Indigenous | Non-Indigenous | Indigenous |
| Major Urban(b) | ||||
| Greater than 1,000,000 | 253,212 | 7,664 | 70.2 | 51.2 |
| Other Urban | ||||
| 20,000 to 49,999 | 17,145 | 987 | 4.8 | 6.6 |
| 10,000 to 19,999 | 21,552 | 2,243 | 6.0 | 15.0 |
| 5,000 to 9,999 | 4,619 | 186 | 1.3 | 1.2 |
| 1,000 to 4,999 | 22,918 | 1,360 | 6.3 | 9.1 |
| Rural | ||||
| 500 or more | 6,734 | 298 | 1.9 | 2.0 |
| 200 to 499 | 3,522 | 797 | 1.0 | 5.3 |
| Other areas | ||||
| Remainder of State/Territory | 30,939 | 1,368 | 8.6 | 9.1 |
| No usual address | 302 | 51 | 0.1 | 0.3 |
| South Australia | 360,946 | 14,975 | 100.0 | 100.0 |
Source: ABS Table Builder, Census 2016.
Note: (a) = Excludes Indigenous status not stated and Migratory, Offshore and Shipping.
(b) = boundaries differ to Greater Capital City boundaries.
Thinking about the bigger picture, raising Indigenous living standards and closing the gap in health and education outcomes is influenced by age structure. Along with other indicators tracking the Indigenous age profile over time provides government with a monitoring tool for assessing changes in health-related outcomes e.g. life expectancy, fertility, etc. While the wider distribution of Indigenous persons across other urban centres outside Adelaide highlights the importance of maintaining/improving access to education services in regional/remote areas.


Hi Mark,
In relation to the ‘Closing the Gap’ targets (or should-be targets), perhaps it’s relevant to mention that at the last Census, there were around 2,500 Indigenous university graduates in SA. Since SA regularly hosts students from other states and the NT, it’s possible that 3,500 Indigenous people have graduated in SA, increasing at about 150 per year. Fuller figures, going back in some cases to 1989, are available on my web-site, on the Higher Education Page.
Looking at the SA Census, what is concerning is the slow decline in the Indigenous fertility rate. Birth numbers seemed to plateau from around 2005 to 2012, then decline markedly. This may mirror the decline in birth numbers across the late seventies (and thus ‘available’ mothers a generation later) Actually the figures for Indigenous Australia as a whole follow similar patterns. It’s very difficult to assess, since half of the Census population rise since 2011 (maybe more than half ?) may well be re-identification rather than net growth, and (taking that re-ID factor into account) the fertility rate may be declining faster than a single Census’ figures indicate.
I lived for some years at a community up on the Murray: back then, in the seventies, it had a population of around 120-140. At the 2-16 Census, the official population was 38, but on a visit there in 2012, I found only one family, amidst about twenty substantial but abandoned houses. Only one house with dogs, anyway. Since then, it has struck me that the place wasn’t so much abandoned as withered away through very low birth rates and high young-adult accident rates. I don’t know if this is an exception, or a forerunner to what may be happening to small, basically unviable, ‘southern’ communities.
Net Indigenous population growth in SA: according to the 2016 Census, 3787 Indigenous babies were born in SA since 2011.
Taking into account the slightly dodgy mortality figures (981 per 100,000), around 1,700 Indigenous passed away in the same period, so net population growth (excluding movement between States and the NT) was about 2,100. But the SA Indigenous population count grew in that period by 3,753. The discrepancy (apart from inter-State movements) of about 1650 (or about 5 % of the total population, or 1 % p.a.) can probably be explained by re-identification. But those mortality figures have to be ‘tweaked’ by only a couple of hundred, to bring that net increase down to 1,900 – and therefore increase the re-identification factor to roughly the same figure, 1,850 or so. So half of the population growth may be attributed to re-identification.
Probably this is the case across Australia, since SA’s population characteristics are a sort of mini-Australia: that half of any ‘population growth’ may be attributed to re-identification. And this has probably been happening ever since the first Census which provided for a box for Indigenous people to tick, back in 1971. If this is so, and working backwards, the Indigenous population in 1971 wasn’t 107,000 – a sixth of the population at the 2016 Census – but more like 300,000 – almost half of the 2016 total, over those 45 years. This may explain why age-cohorts ‘grow’ between Censuses.
Try it: put all the Census figures on a spread-sheet and work backwards, adjusting for realistic mortality rates for each age-cohort. Of course, this is all pretty rough, but if one uses low mortality figures over that period, the adjusted population totalled around 300,000 in 1971; and if higher (and more realistic) mortality figures are used, the population in 1971 may have been as high as 350,000. So ‘real’ net population growth in 45 years may have been as low as 1.4 % p.a. This may be corroborated by the low birth-rates, which may not be growing in real terms at all.
I should have pointed out that there are currently around fifty four thousand Indigenous university graduates across the country, two-thirds women, overwhelmingly urban, and perhaps 90 % from mainstream degree-level courses – that’s around 48,000 in the 2016 Census, plus about 3,000 in 2016 and again in 2017. It’s puzzling why parity in graduate numbers between Indigenous and non-Indigenous Australians isn’t one of the ‘Closing the Gap’ targets: perhaps the concept of ‘Indigenous university graduate’ is too new for policy-makers.
Here’s another stat: Indigenous women are commencing university study at a slightly higher rate (for their respective populations) than NON-Indigenous Australian men.
And another one: Indigenous graduates are 95 % likely to marry non-Indigenous graduate partners, and both working. They are very likely to ensure that their children go on to university study.
And another one: in 2016, Indigenous university commencements rose by 12 % – for most of the past ten years, the annual increase has been around 8 % – yes, commencement numbers in award-level courses has risen from 3,139 in2006 to 6,715 in 2016, or 114 %. These are Ed. Dept figures, which may under-count Indigenous university numbers by as much as 30%, relative to Census figures.
So why isn’t university participation one of the ‘Closing the Gap’ targets ?
Hi Mark, I should have pointed out that, with an annual growth rate in university commencements and graduations over the past decade of about 8 % (a rate which may be maintained for some time yet), it’s possible that in barely another decade, there could be well over one hundred thousand Indigenous university graduates, and 140-150,000 by 2030 or so. That would be one in every four adults, one in every three women and one in every five or six men – even better in urban areas. Certainly, many get sucked into the Industry and thereby, unwittingly, strengthen the Apartheid power-structure of the elites. But i live in hope that more and more Indigenous people can escape the clutches of the Industry, especially in the cities.
Hi Mark, i suppose you will eventually see these comments 🙂 There is another, more fundamental, aspect to improvements Indigenous university participation; it doesn’t occur for no reason on the on hand, and will have positive and immense effects on Indigenous social structure and social change, on the other. Consider; over the past nine years (2008-2016), commencement numbers almost doubled. How and why ? Does increase in participation reflect, perhaps crudely, the changes in the level of aspirations within the (mainly urban, working) Indigenous community, and more significantly the standard of living ? Could it be said that what we are witnessing is a ‘doubling’ in the standard of living of the entire Indigenous community every nine or ten years ? Of course, re-identification has a lot to do with the increase in Census numbers, but is it like that those improvements will be maintained at the same rate ? Why not ? University participation has causes, in the ambitions of both parents and students themselves, in their expanding perception of its value. And university participation has social consequences, in that the stock of graduates, now well over fifty thousand, is likely to double every nine or ten years, or by five or six times each generation. Given that there are currently around four hundred thousand Indigenous adults across Australia, one in every eighty or so being a university graduate, is it possible that (taking Census re-identification into account) that another generation may see that ratio drop to one in every three adults ? And given that few graduates come from and return permanently to rural and remote ‘communities’, is it possible that, in the next generation, close to half of all Indigenous adults in the cities could be university graduates, mostly in mainstream courses and with half of those going on to post-graduate study ? Will the material effects of all that on the Indigenous population be massive, transforming ? And why isn’t university participation be counted as one of the measures towards ‘Closing the Gap’ ?
Fat fingers ! That should read: “Given that there are currently around four hundred thousand Indigenous adults across Australia, one in every EIGHT or so being a university graduate, is it possible that (taking Census re-identification into account) that another generation may see that ratio drop to one in every three adults ?”
Hi Joe,
Thanks for your comments and interest in the topic. The blog post was intended to examine South Australia’s Indigenous age profile and illustrate information and data utilised at .id. If you would like to enquire about further work .id can do regarding the issues you have raised, please contact .id on info@id.com.au
Regards,
Mark