What are the characteristics of low-income households in your area?
In this blog, Glenn demonstrates how to use the Low-income households module in our community profiles to get a clear picture of people on lower incomes in your community, and how that information can be used for advocacy and service planning.
Many government services are targeted towards helping people on low incomes, so a nuanced understanding of this community in your area is essential for reporting, advocacy and grant funding opportunities.
This is why we’re pleased to announce that we’ve now fully updated the Low Income Households Community of interest module with 2016 and revised 2011 Census data, for all councils and regional authorities who subscribe to that module within their community profiles (around 50 local government areas currently).
Unlike our standard profiles, Communities of interest allow you to learn more about the characteristics of one community, using cross-tabulated data.
Communities of interest: a refresher
If you don’t use our tools all that often, a reminder that Communities of Interest are special modules in our community profiles that let you see the detailed demographic characteristics of a particular subset of your community.
This blog focuses on Low-income Households, but there are also communities of interest modules for the Indigenous population, Specific age groups, Recent arrivals, Non-English speakers, those Born overseas and those with a Need for assistance.
Not all councils subscribe to all Communities of Interest modules, so some data may not be currently listed in your area (but it is available). You can learn more about that here.
Don’t have the low-income households module?
If you’re with a council and you would like this module added to your community profile, you can get in touch with us here. Or, if you’re a member of the community, you can register your interest in having this module added in your area by telling us how you would use this data in your work, here.
Defining low-income households
Analysing the usage of the Low-income households module from 2011, we have made a few changes. The main one is redefining ‘Low Income’ on the basis of equivalised household income.
Previously, we used total household income, which meant that low incomes (approximately the bottom 20% of incomes in the country) in many cases largely comprised asset rich, cash poor pensioners living alone.
Why we use equivalised incomes
While some of these are still in there under the new definition, using equivalised income makes this far more applicable to families and other household units.
Equivalised income makes adjustments to income to allow for household size and composition (number of adults and children) to put all households on an equal footing.
For instance, a couple family with 3 children on a total income of $1,500 per week would have an equivalised household income of only $625 per week, once the number of dependents is taken into account. Using this definition narrows low incomes to those likely to be in genuine need in the community.
For 2016 we have used the cutoff of $500 per week (equivalised) as the measure of low income in Australia, while in 2011 we have used $400 per week. This adjusts for inflation, but due to the need to use whole ABS income ranges, there is still a slightly higher percentage of households captured in 2016 (about 22% of all households compared to 20% in 2011).
Analysing low-income household data
So what does this module show?
Well, let’s have a look at an example in Blacktown City Council, Western Sydney.
Blacktown City Council has 21,379 households classified as low income in 2016, (about 19% of all households) containing just under 60,000 people. The distribution of these households is heavily in a few suburbs, primarily around the Mt Druitt area, suburbs containing large amounts of public housing such as Wilmot and Bidwill.
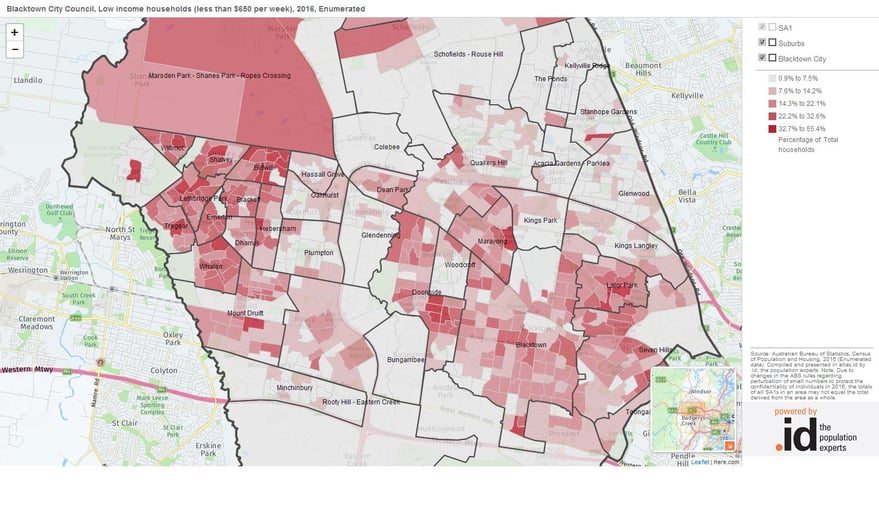
Source: Blacktown City Council Social Atlas – Low-income households
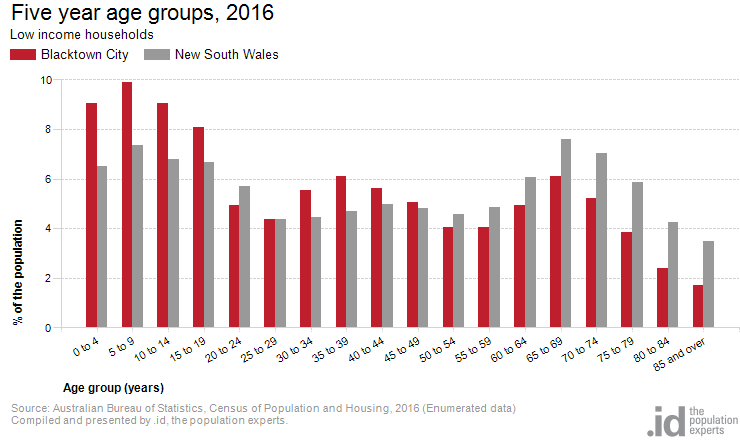
The Communities of Interest module lets us investigate the age structure of these households – revealing that, compared to the total population of Blacktown, they are relatively more likely to be older, or to be children.
But compared to low-income households across NSW, those in Blacktown are heavily skewed towards children. In fact, 28% of those in the bottom quintile households in Blacktown are aged under 15.
Looking at household types confirms this, with double the NSW rate of low-income households being in couples or single parent families. And most of the increase in low-income households over 5 years was in the “Couples with children” category.

Because they are more likely to be families, Blacktown’s low-income households are also more likely to be in the labour force, though the majority are not – only 33% were in the labour force, and 30% of those were unemployed (but this is similar to the NSW average). Their occupations are also highly skewed to blue-collar sectors, such as Labourers and Machinery Operators and Drivers.
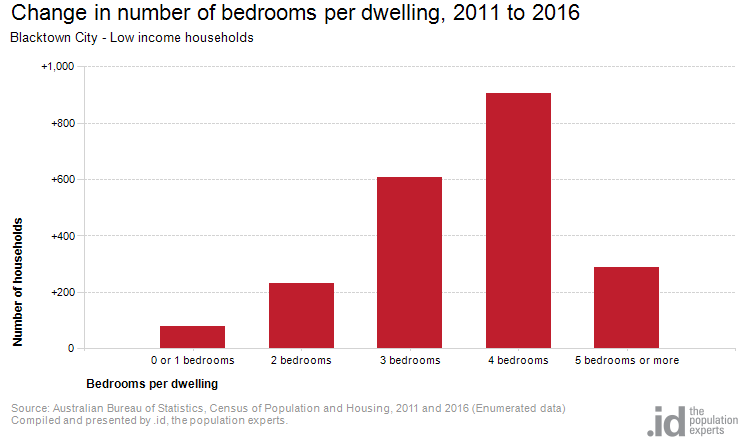
Though clearly a disadvantaged group, Blacktown’s low-income households are much more likely to live in larger dwellings than many areas, with 21% living in dwellings of 4+ bedrooms, and the biggest increase being in this category. They are also increasingly likely to be driving 2 or more cars per household
All this points to an increasing population of low-income “Working families”, to coin a term; those moving to Blacktown for relatively affordable housing, and having children there.
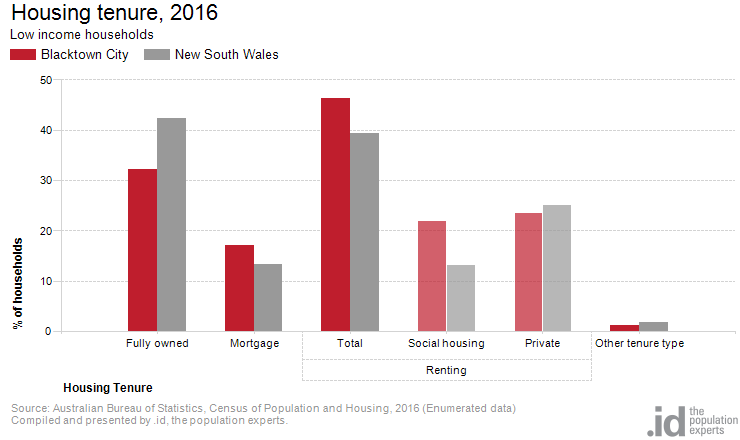
In the past, the high level of social housing in Blacktown has provided support for those on low incomes. However, while it’s still a very important tenure type, it now only accounts for 22% of those on low-incomes, and declined between 2011 and 2016.
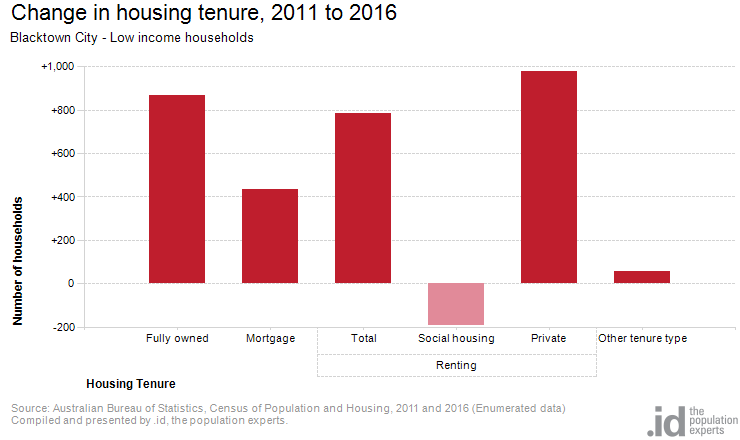
What’s taken up the difference? It’s largely in private rental, up by almost 1,000 households over 5 years.
So we have an increasing number and proportion of those on low incomes paying market rents in private rental over time. These are mainly families with young children in blue-collar jobs.
This is useful information, but mostly it enables the council to work on assistance and advocacy programs, perhaps in the affordable housing area, giving an evidence base to advocate to other levels of government for possible intervention in this area.
The Low-income households module is now live as a part of profile.id for all our Local Government clients who subscribe to this particular Community of Interest.
Can’t find this module in your area? Get in touch with us here and tell us what you’re working on.
Glenn - The Census Expert
Glenn is our resident Census expert. After ten years working at the ABS, Glenn's deep knowledge of the Census has been a crucial input in the development of our community profiles. These tools help everyday people uncover the rich and important stories about our communities that are often hidden deep in the Census data. Glenn is also our most prolific blogger - if you're reading this, you've just finished reading one of his blogs. Take a quick look at the front page of our blog and you'll no doubt find more of Glenn's latest work. As a client manager, Glenn travels the country giving sought-after briefings to councils and communities (these are also great opportunities for Glenn to tend to his rankings in Geolocation games such as Munzee and Geocaching).