By 2050, an estimated 3.5 million Australians will use aged care services each year. The growing cohort of older Australians is well documented, with Australians living longer and the large baby boomer generation entering retirement. Increasing living standards mean older Australians can stay out of care for longer and there is growing demand to ‘age in place’ so it’s increasingly important to understand where and when broad demographic ageing trends translate into demand for aged care services.
.id works with Australian aged care providers to help them answer this question so they can plan services in the right place at the right time. In this blog, we take a look at how the demand for aged care services across Victoria will play out locally.
Two distinct aged care markets
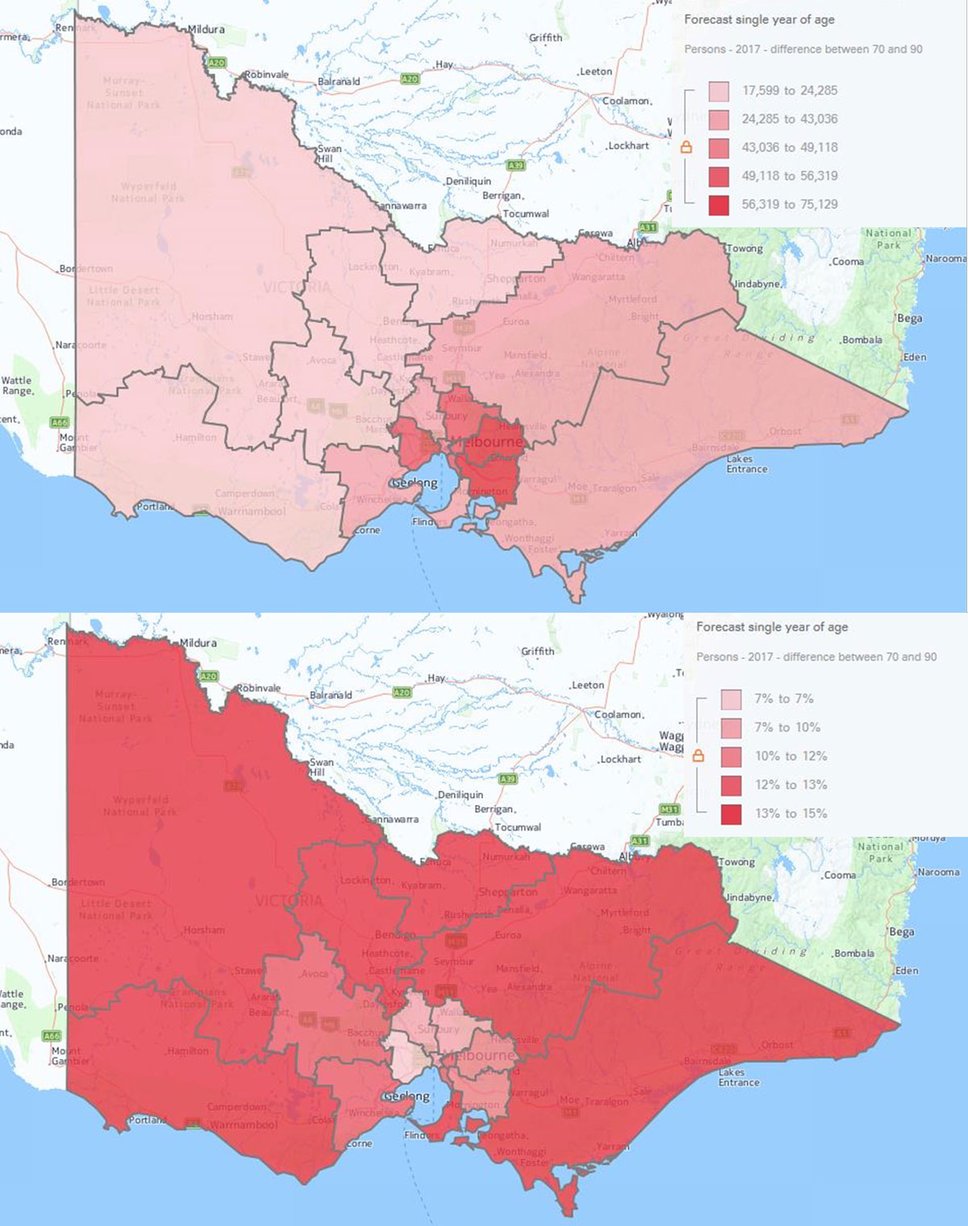
Using the Australian Government ‘planning population’ of people aged 70+ to determine where aged care services are required, we can see on the maps below how this segment of the population is distributed across Victoria by number and proportion of the total population. The maps are almost mirror-images; highlighting the unique characteristics of aged care markets in the city versus regional areas.
70+ population in Victoria, by number and proportion of the total population, 2017

Source: .id SAFi (Small Area Forecast information)
Looking firstly at Greater Melbourne we can see it has the bulk (approximately 63%) of all older Victorians, lead by the South East region. As a result, the top priorities for service providers in these areas are to keep up with the sheer scale of demand and secure access to facilities as land use and residential development intensifies.
However, communities in regional Victoria have a much larger proportion of older residents. This is close to 15% for regions such as the North West and Latrobe – Gippsland (i.e. 15% of the total population is over 70 years old) compared to the average of 9.9% across Melbourne and 7.0% in Melbourne’s West. Aged care service providers in regional areas therefore not only face the challenge of offering increasingly tailored home-based care across large distances, but they also have a smaller support population (e.g. family members, workforce) to draw on when assisting older Victorians.
Understanding demand by considering the need for assistance
When it comes to providing services, the Government considers a person’s frailty or functional disability, rather than age, to determine if they are eligible for assistance. Given this, to understand the demand for aged care services we need to look at both age and need for assistance.
Using the 2011 Census of Population and Housing, we know that approximately 115,000 Victorians over 70 were in need of assistance. Delving further into the data, the local government areas (LGAs) with the highest numbers of Victorians within this group were:
- Greater Geelong: 5858 people
- Moreland: 5458 people
- Monash: 4736 people
- Brimbank: 4685 people
- Darebin: 4558 people
Some of these LGAs seem to make the top five largely because they have significant cohorts of older people. For example Greater Geelong, Monash and Moreland were also in the top 5 LGAs for total people over 70+ in 2011. For others, they have a higher rate of older people needing assistance. Brimbank fits in this category, with 36% of all 70+ people needing assistance as compared to the state average of 24%. What the demographic data doesn’t tell us in this case, is how the relatively higher rates of socio-economic disadvantage experienced in this area play a role.
Close to home demand – caring in-home or near families
The Productivity Commission predicted that of the 3.5 million older Australians that will access aged care services each year by 2050, around 80% of these services will be delivered in the community. The aged care sector is evolving in response to this demand for more flexible, consumer-centered services. Increasingly this means that more Australians are wanting to age within their own homes and have services come to them. Alternatively, if choosing residential care, a key consideration when choosing a facility is how close or accessible it is to their partners and families.
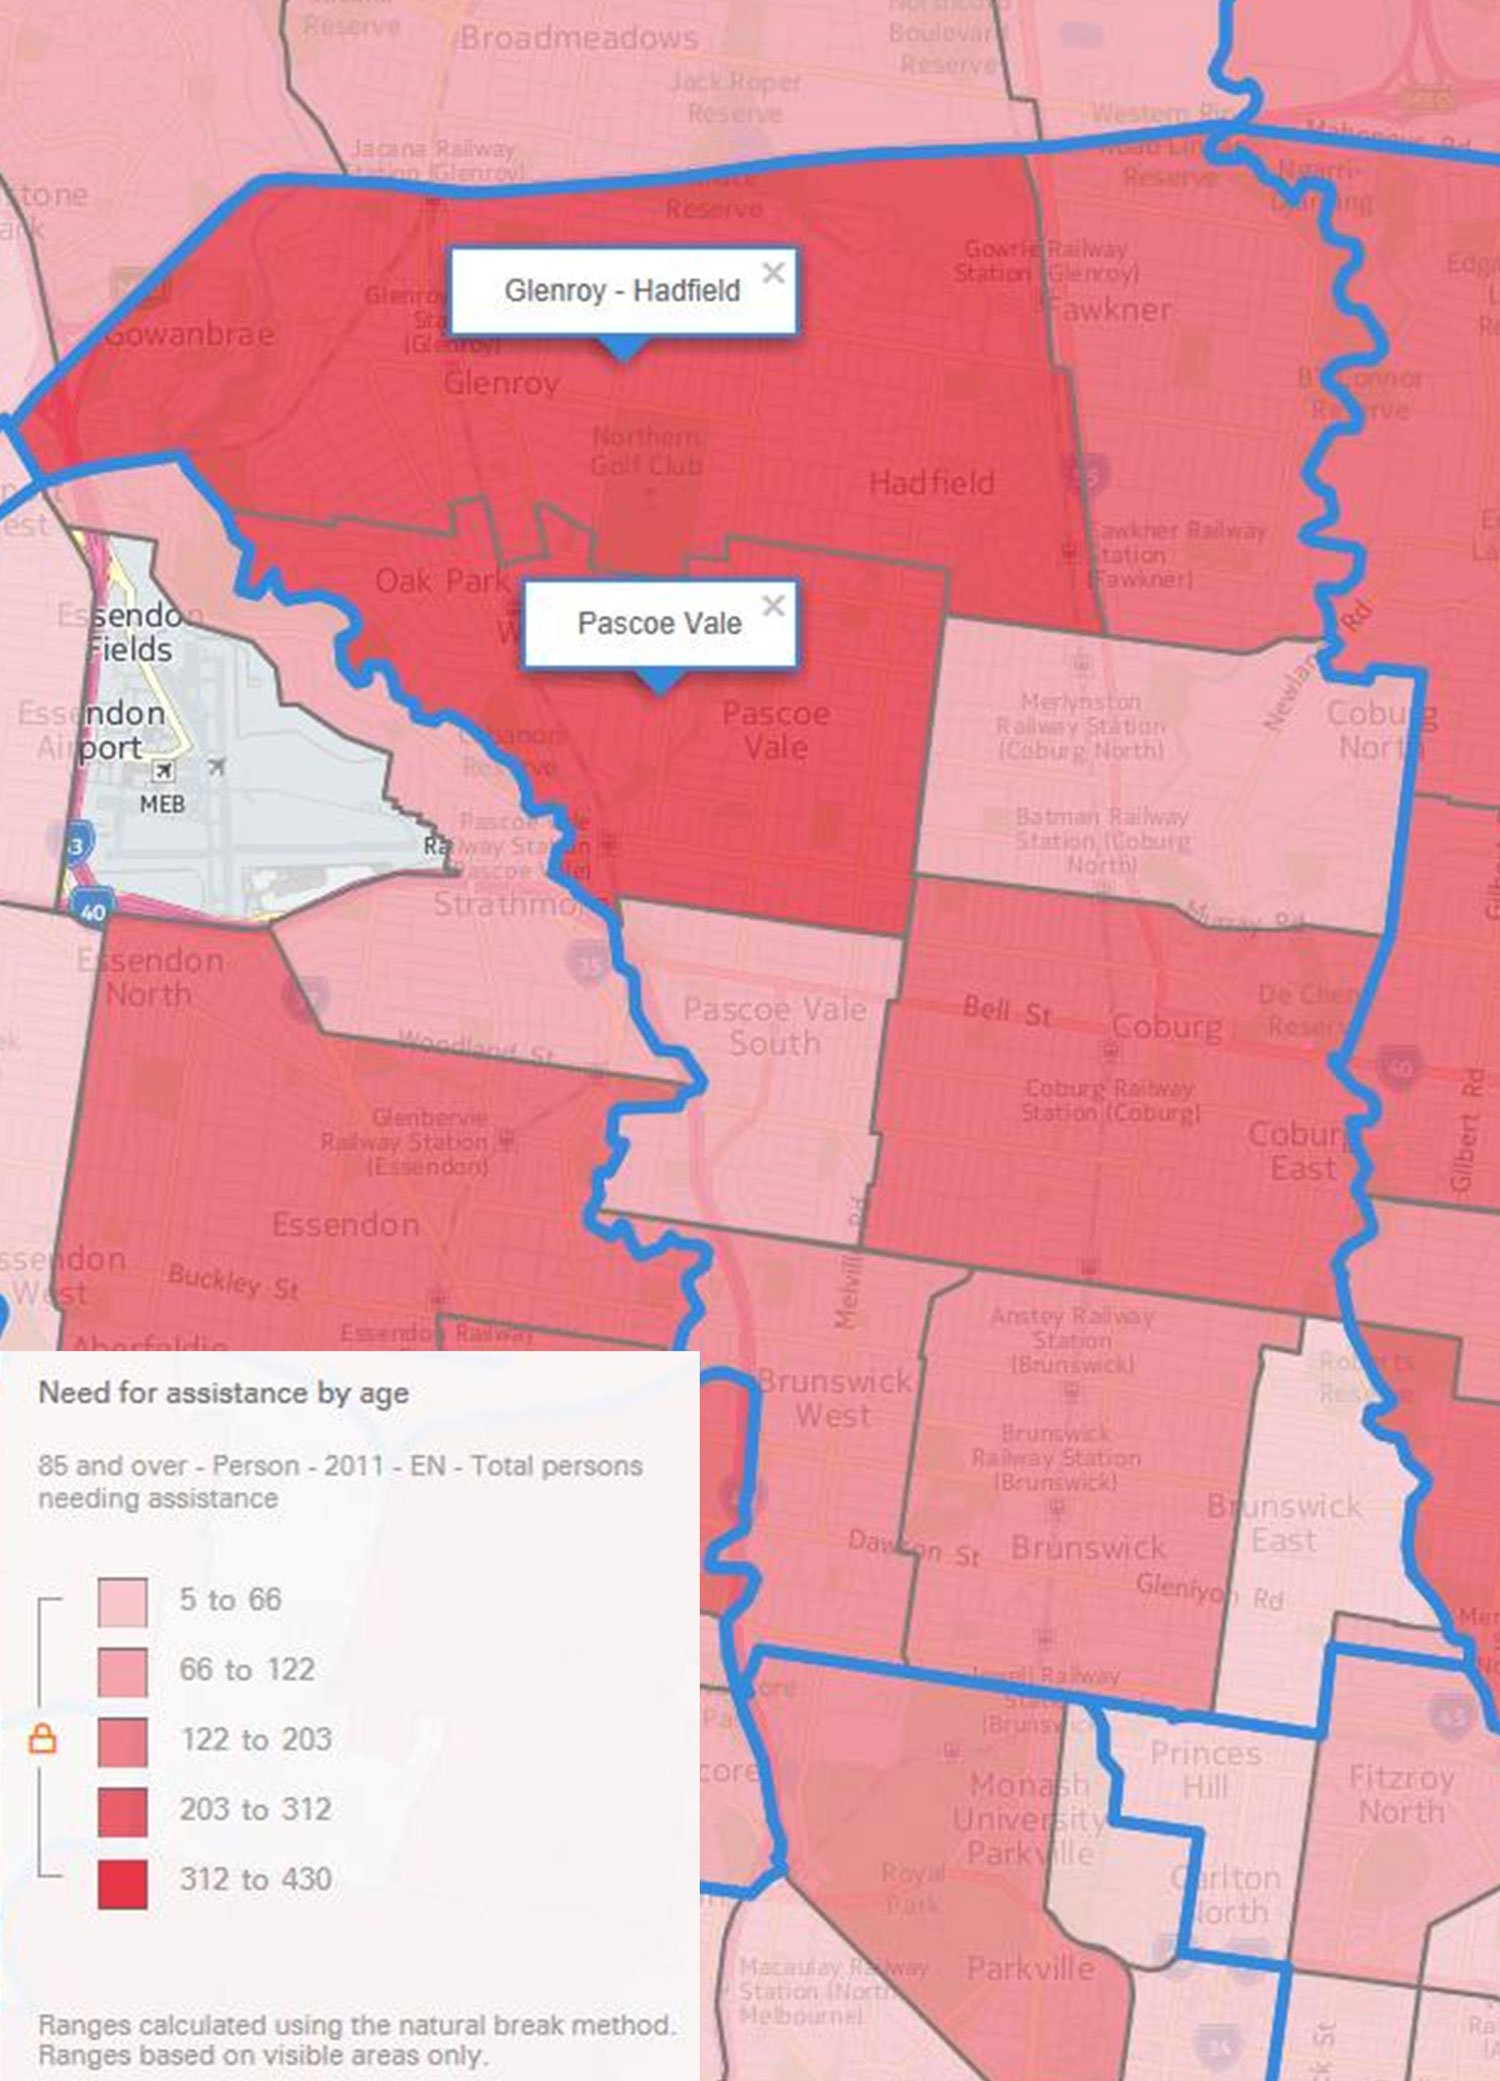
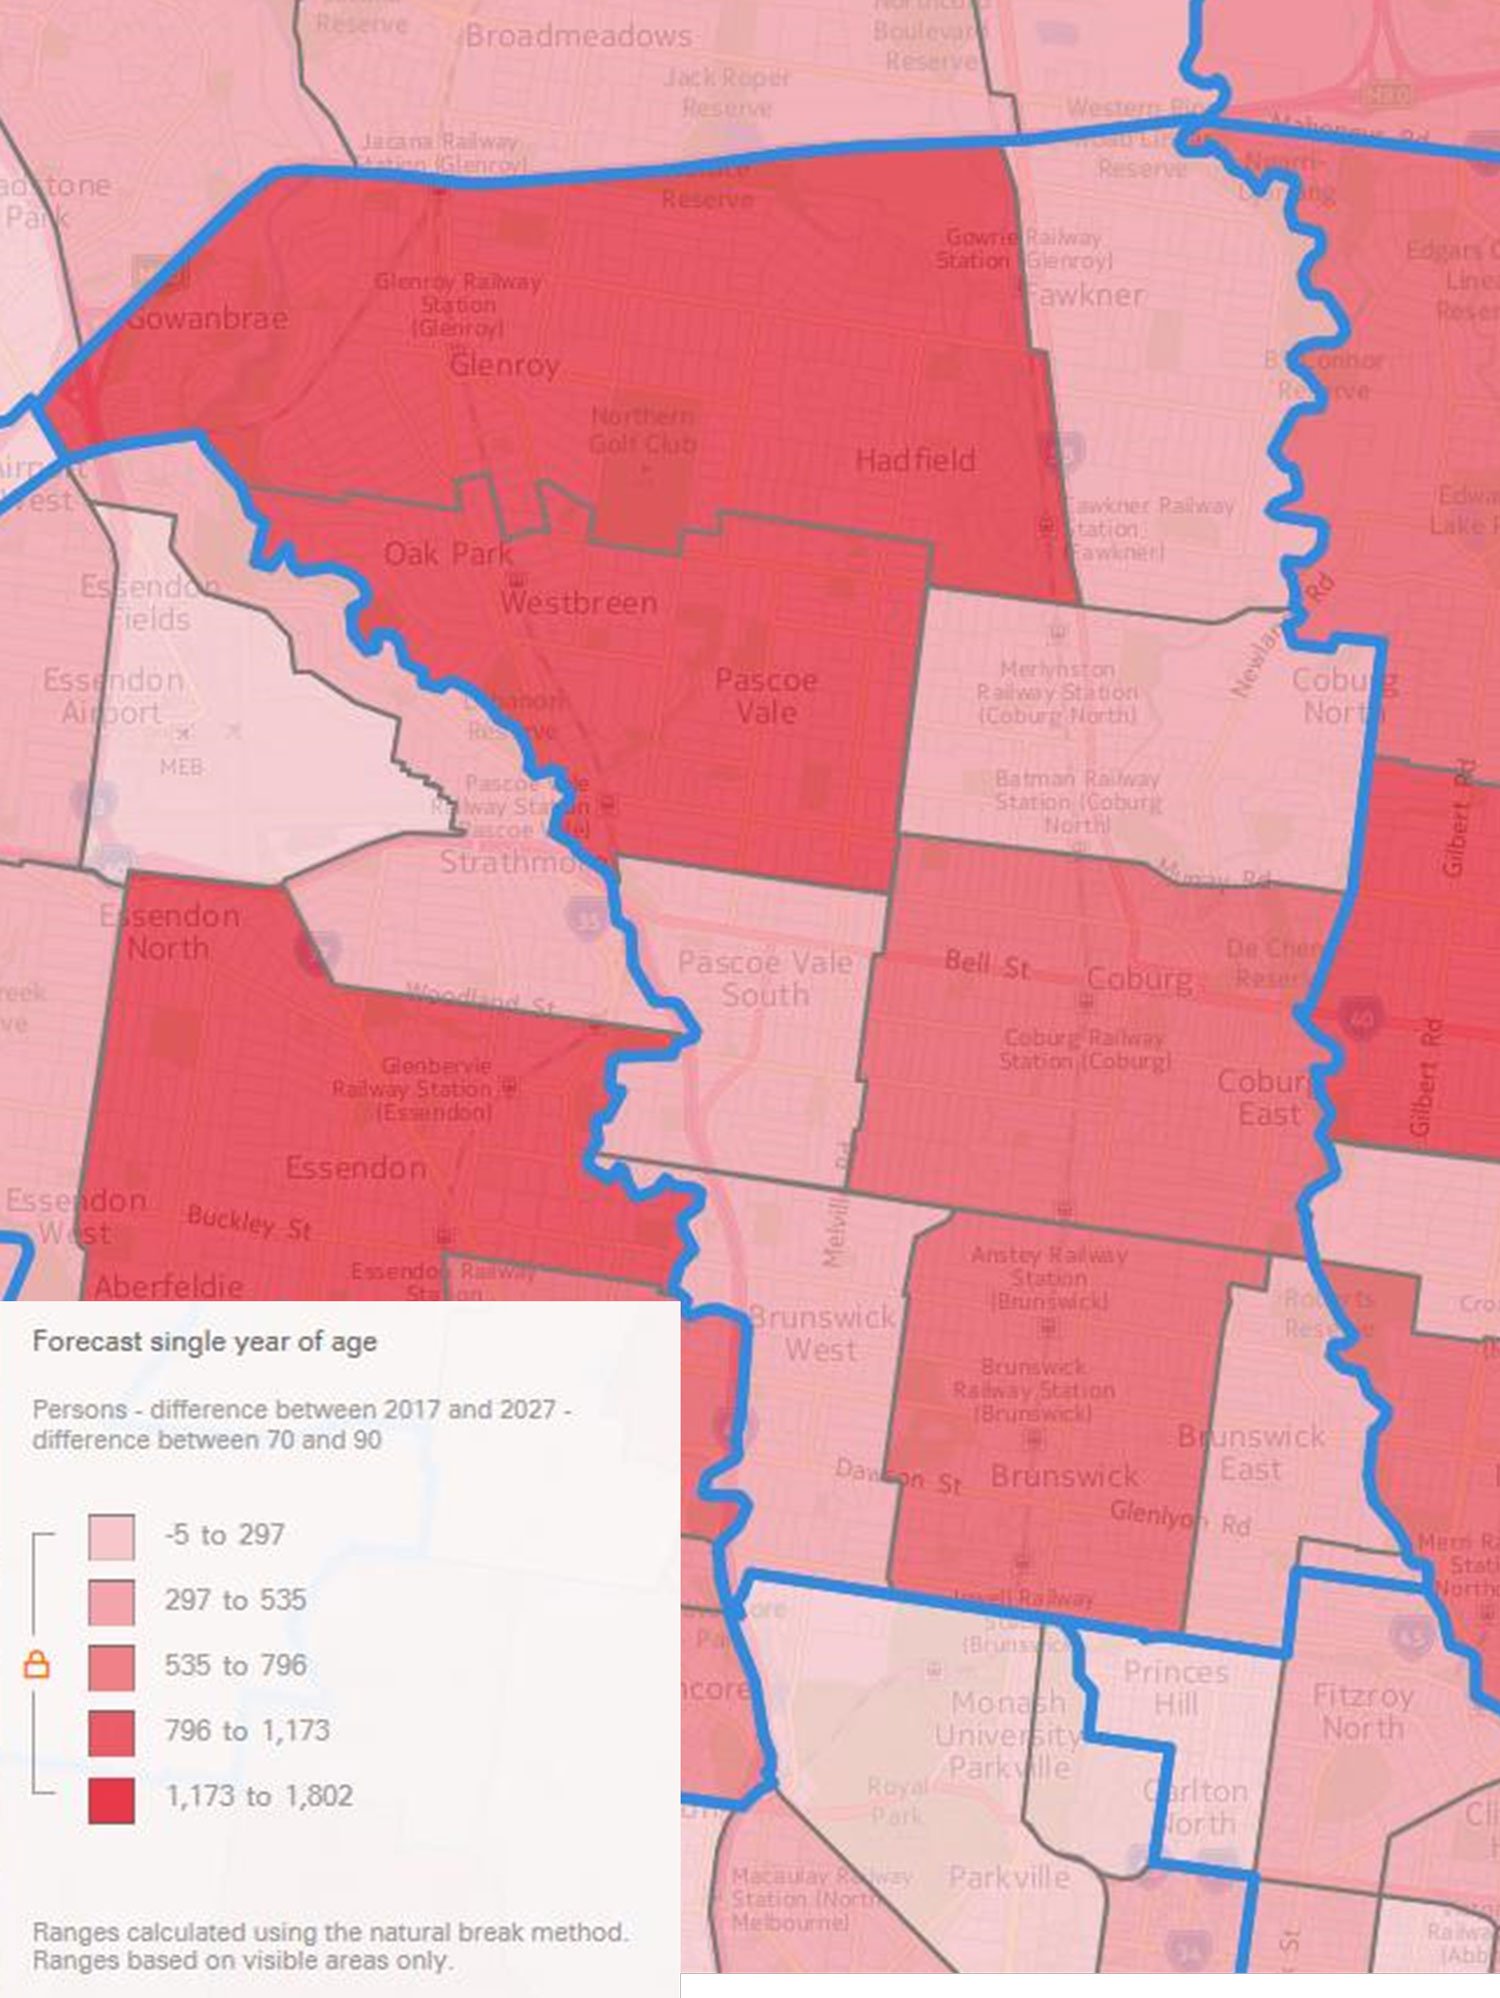
Given this, it is important to understand where demand for aged care services falls at a local level. Taking the LGA of Moreland as an example, the map below shows where those older Victorians (looking here at the oldest cohort of people aged 85+) needing assistance live. They are concentrated in the northern end of the LGA, particularly the suburbs of Glenroy and Pascoe Vale. This trend looks to continue in the future, with the forecast population of 70+ year olds (shown right) also concentrated in these suburbs.
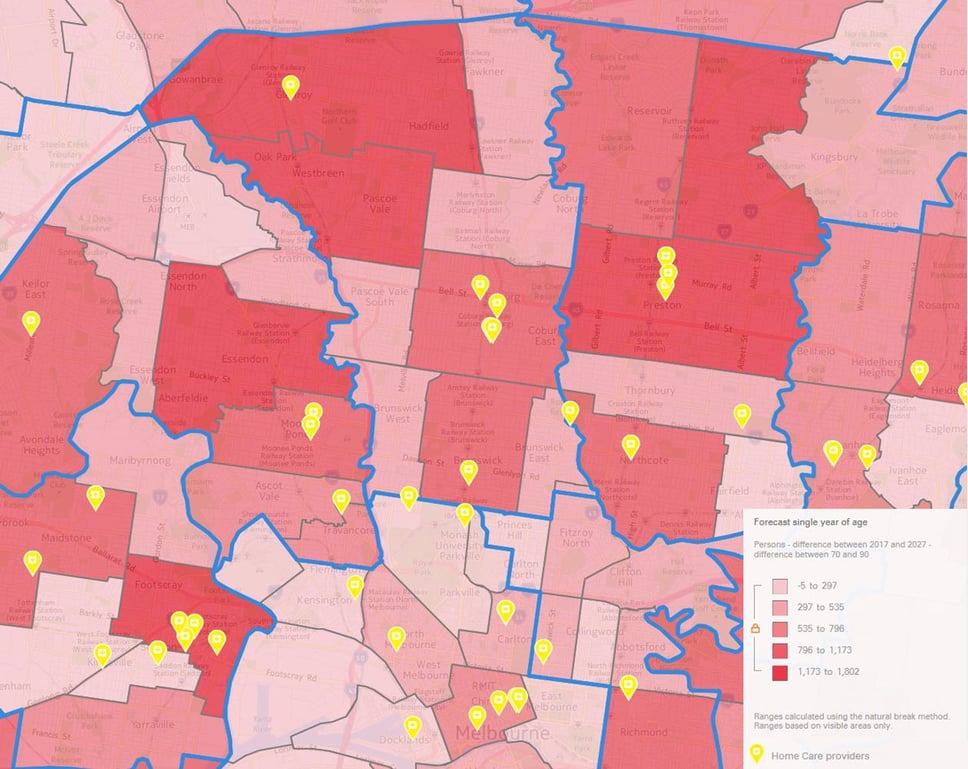
When we compare this with where existing aged care services are located, we can see that demand and supply are not necessarily well aligned. For example, the map below shows the location of homecare providers (the increasing preference of consumers) in the same area; many of the existing services are concentrated further south where there is less demographic demand for aged care services.
Moreland aged care market analysis – Home Care providers, compared to forecast population 70+, 2017 – 2027

Source: .id SAFi and home care providers
This small case study demonstrates how the aged care market needs to not only keep up with a dramatic growth in demand but also refine how and where is delivers services if it is to best meet the future needs of older Victorians.
.id is a team of demographers, population forecasters, spatial planners, urban economists, and data experts who use a unique combination of online tools and consulting to help governments and organisations understand their local areas. Access our free demographic resources here


