Economy.id functionality summary
Economy.id has now been completely redeveloped with a raft of new functions and features.
Each section of economy.id provides information in data tables and graphs with detailed explanations and data sources.
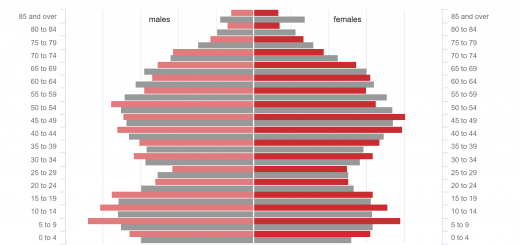
Data is presented in context, using both time series and benchmarks to other areas to highlight growth trends or declining characteristics and to clearly pinpoint areas of relative advantage.
All tables are exportable to Excel in .csv format and all charts are exportable directly to Word as a .jpg image.
Some functions, such as journey to work by industry and work destination profiles use interactive maps as well as tables to convey the information most clearly.

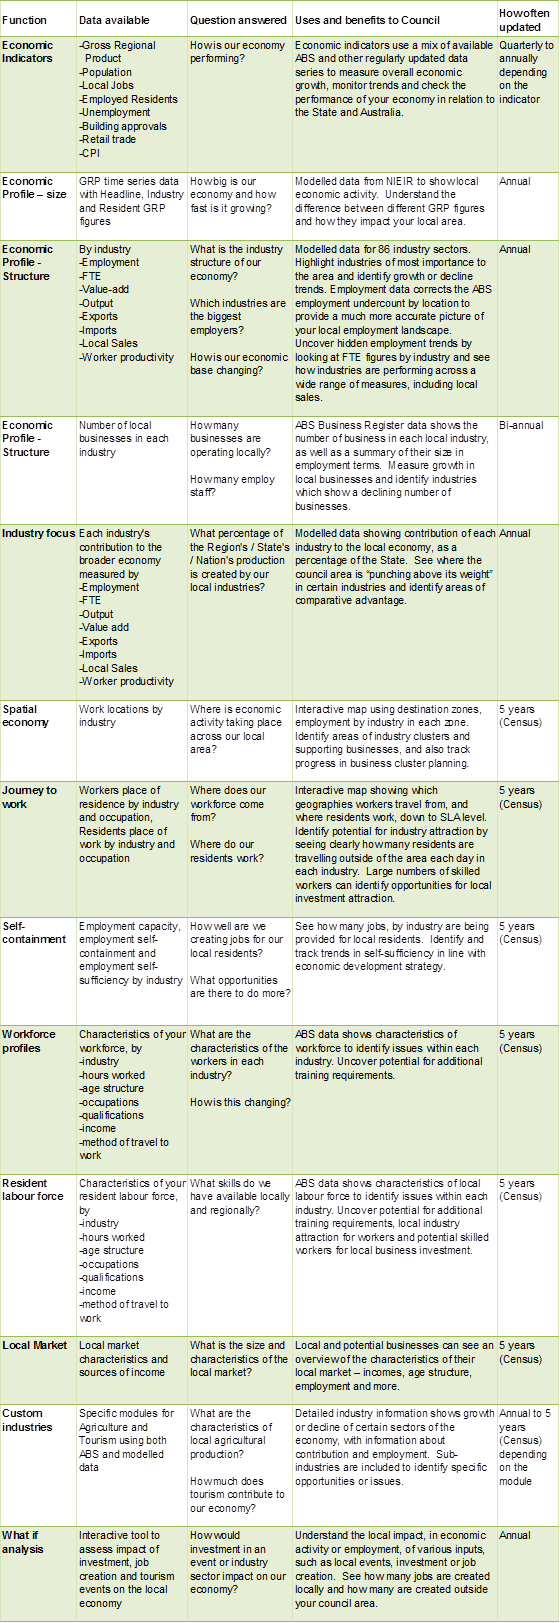
The table below explains the data available, benefits and potential uses of the information:
For more information about economy.id, please visit the economy.id page on the .id website or click here to view a brief introductory video.
![]()